
What is the Analytics Dashboard? #
Analytics is the performance dashboard for your loyalty program. It includes four headline stat cards, a trend chart, and six widgets covering earning rules, redemption mix, referrals, top rules, top customers, and recent activity.
A single date-range selector controls the reporting period for the dashboard.
Why Do You Need It? #
- Understand how points are moving: See how many points are being issued, how many are being redeemed, and which customers and rules are responsible.
- Find weak areas: Rules that nobody triggers and rewards that nobody redeems become easier to spot.
- Compare consistent figures: Most widgets use the same reporting period, so the data can be compared directly.
Prerequisites #
- An Administrator account.
- No additional setup is required. Analytics fills automatically as your loyalty program records activity.
Where to Find It #
Go to Pointics → Analytics.
/wp-admin/admin.php?page=pointics#/analyticsThe page header displays “Your loyalty program performance at a glance.”
Step-by-Step Instructions #
Step 1: Choose a Date Range #
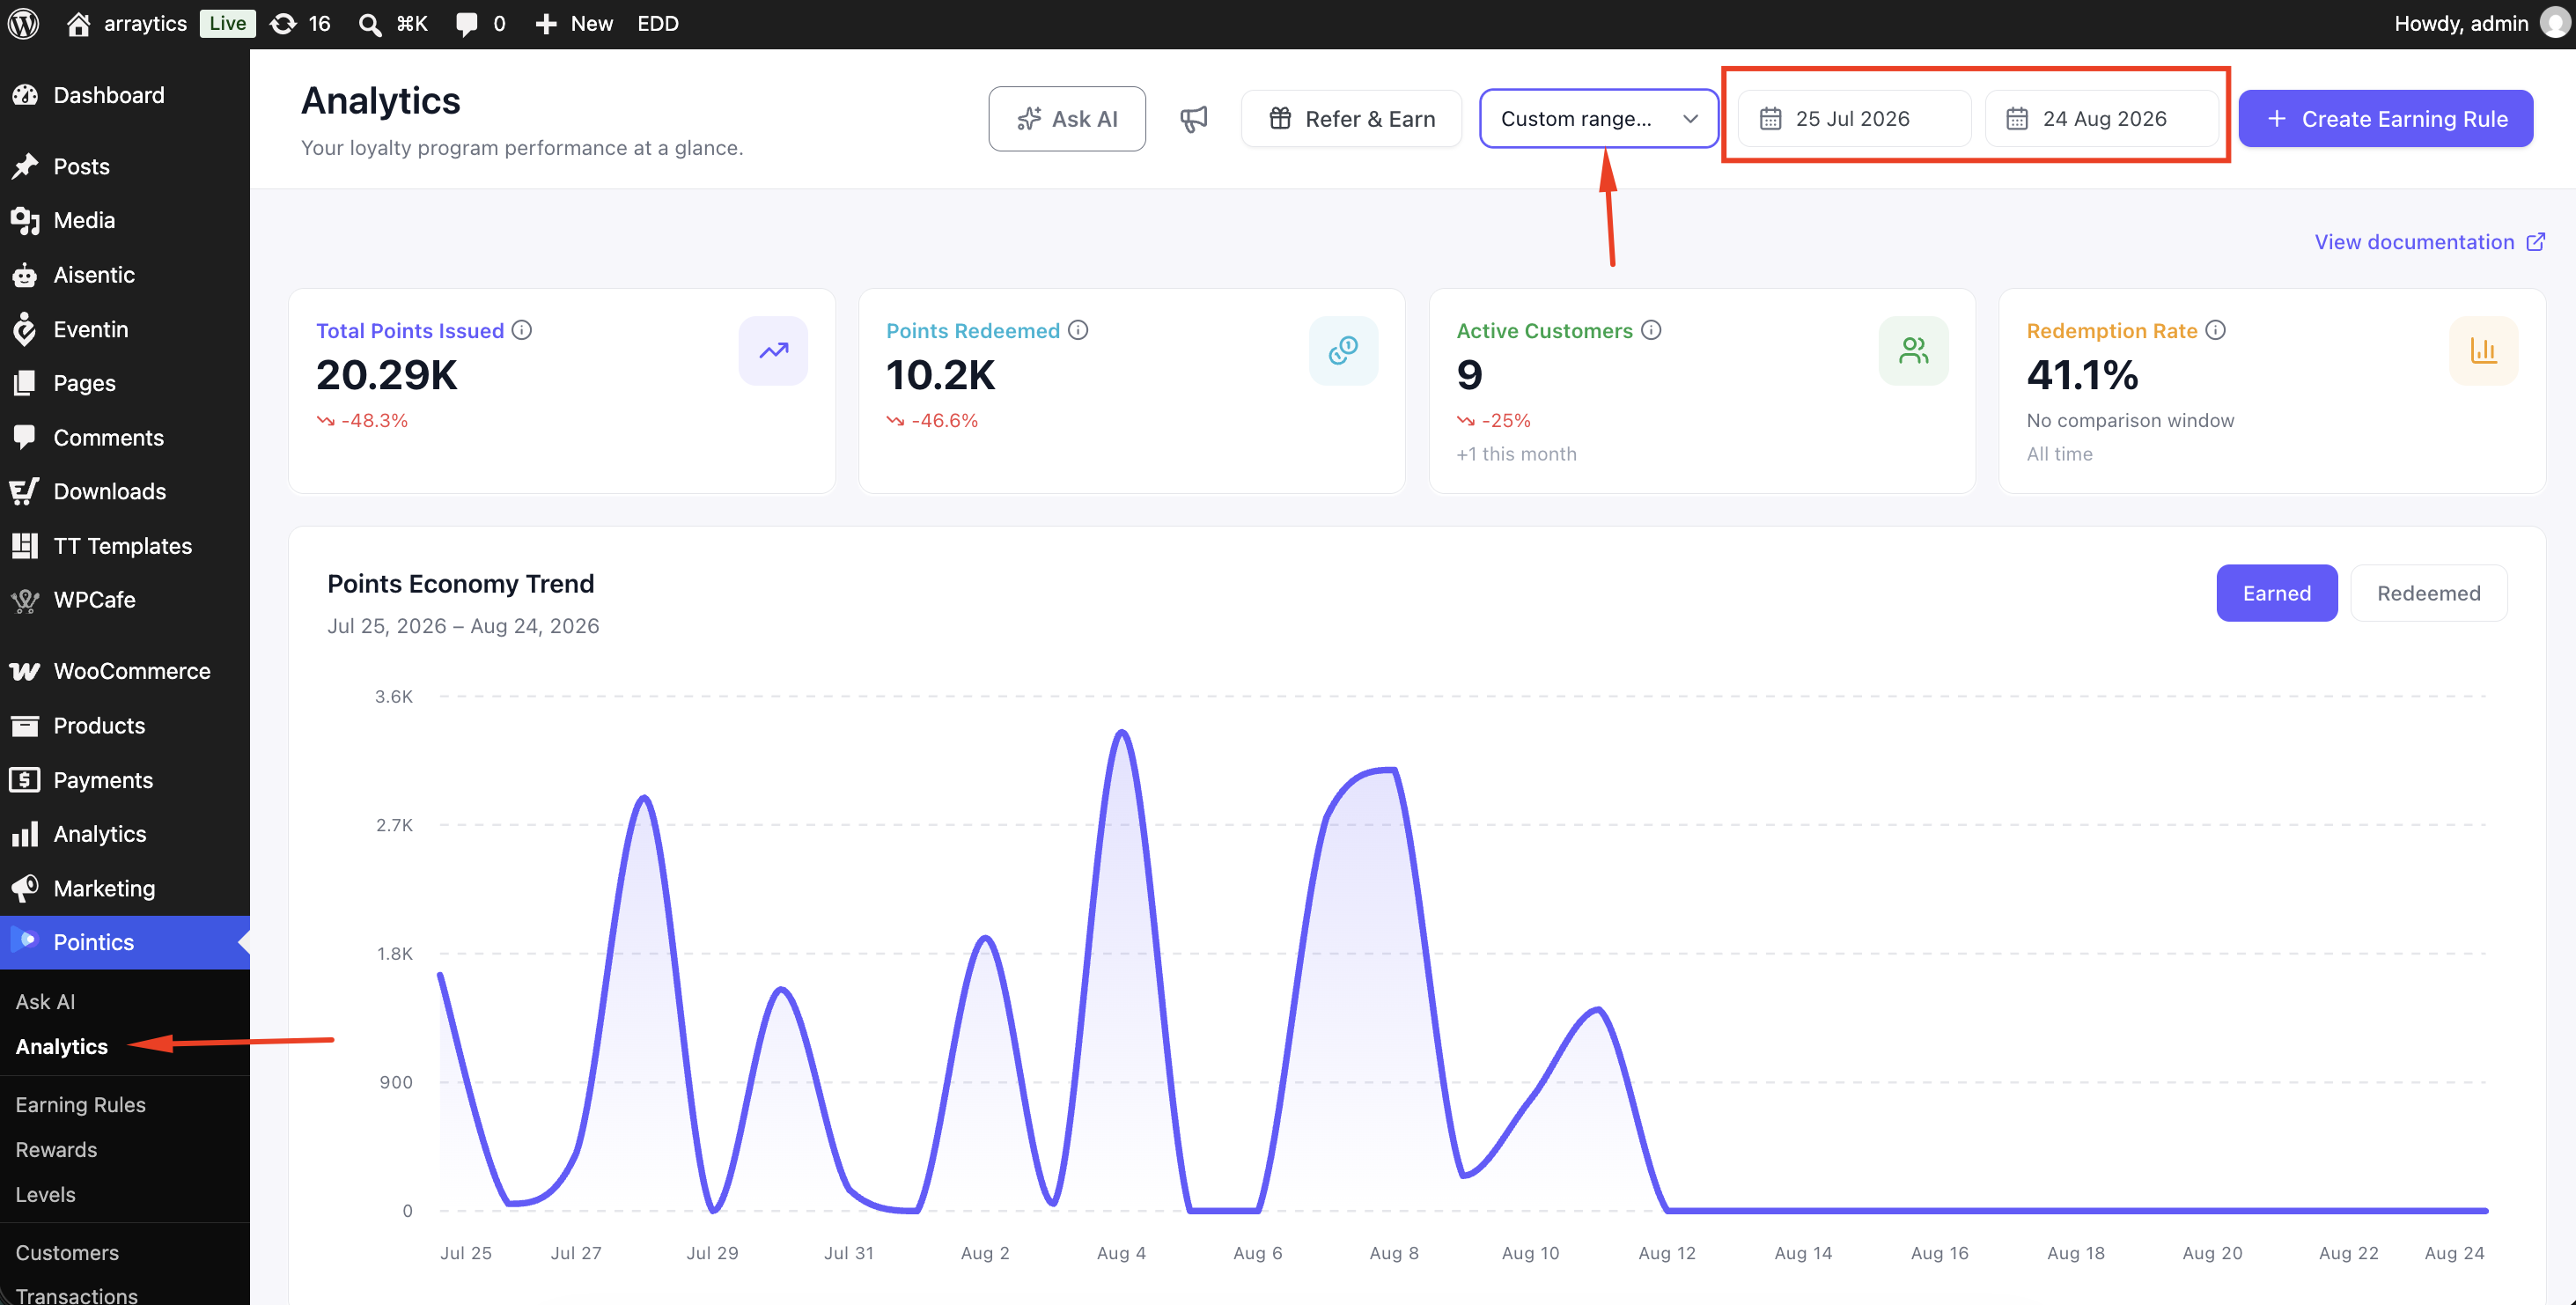
The Date Range selector appears in the page header and controls every date-based widget on the dashboard.
| Option | Period |
|---|---|
| Last 7 Days | 7 whole days including today |
| Last 30 Days | 30 whole days including today |
| Last 90 Days | 90 whole days including today |
| This Month | The current calendar month to date |
| Last 12 Months | 12 months aligned to the same day of the month |
| Year to Date | The current calendar year to date |
| All Time | Everything since the first transaction |
| Custom Range… | Select your own From and To dates |
The default reporting period is Last 12 Months.
For a custom range, both dates must be selected before the range is applied. Until then, the relevant headings display “Pick both dates.” A new custom range initially uses the last 30 days.
All periods use your site’s timezone. A date entered without a time includes the entire day.
Step 2: Read the Stat Cards #
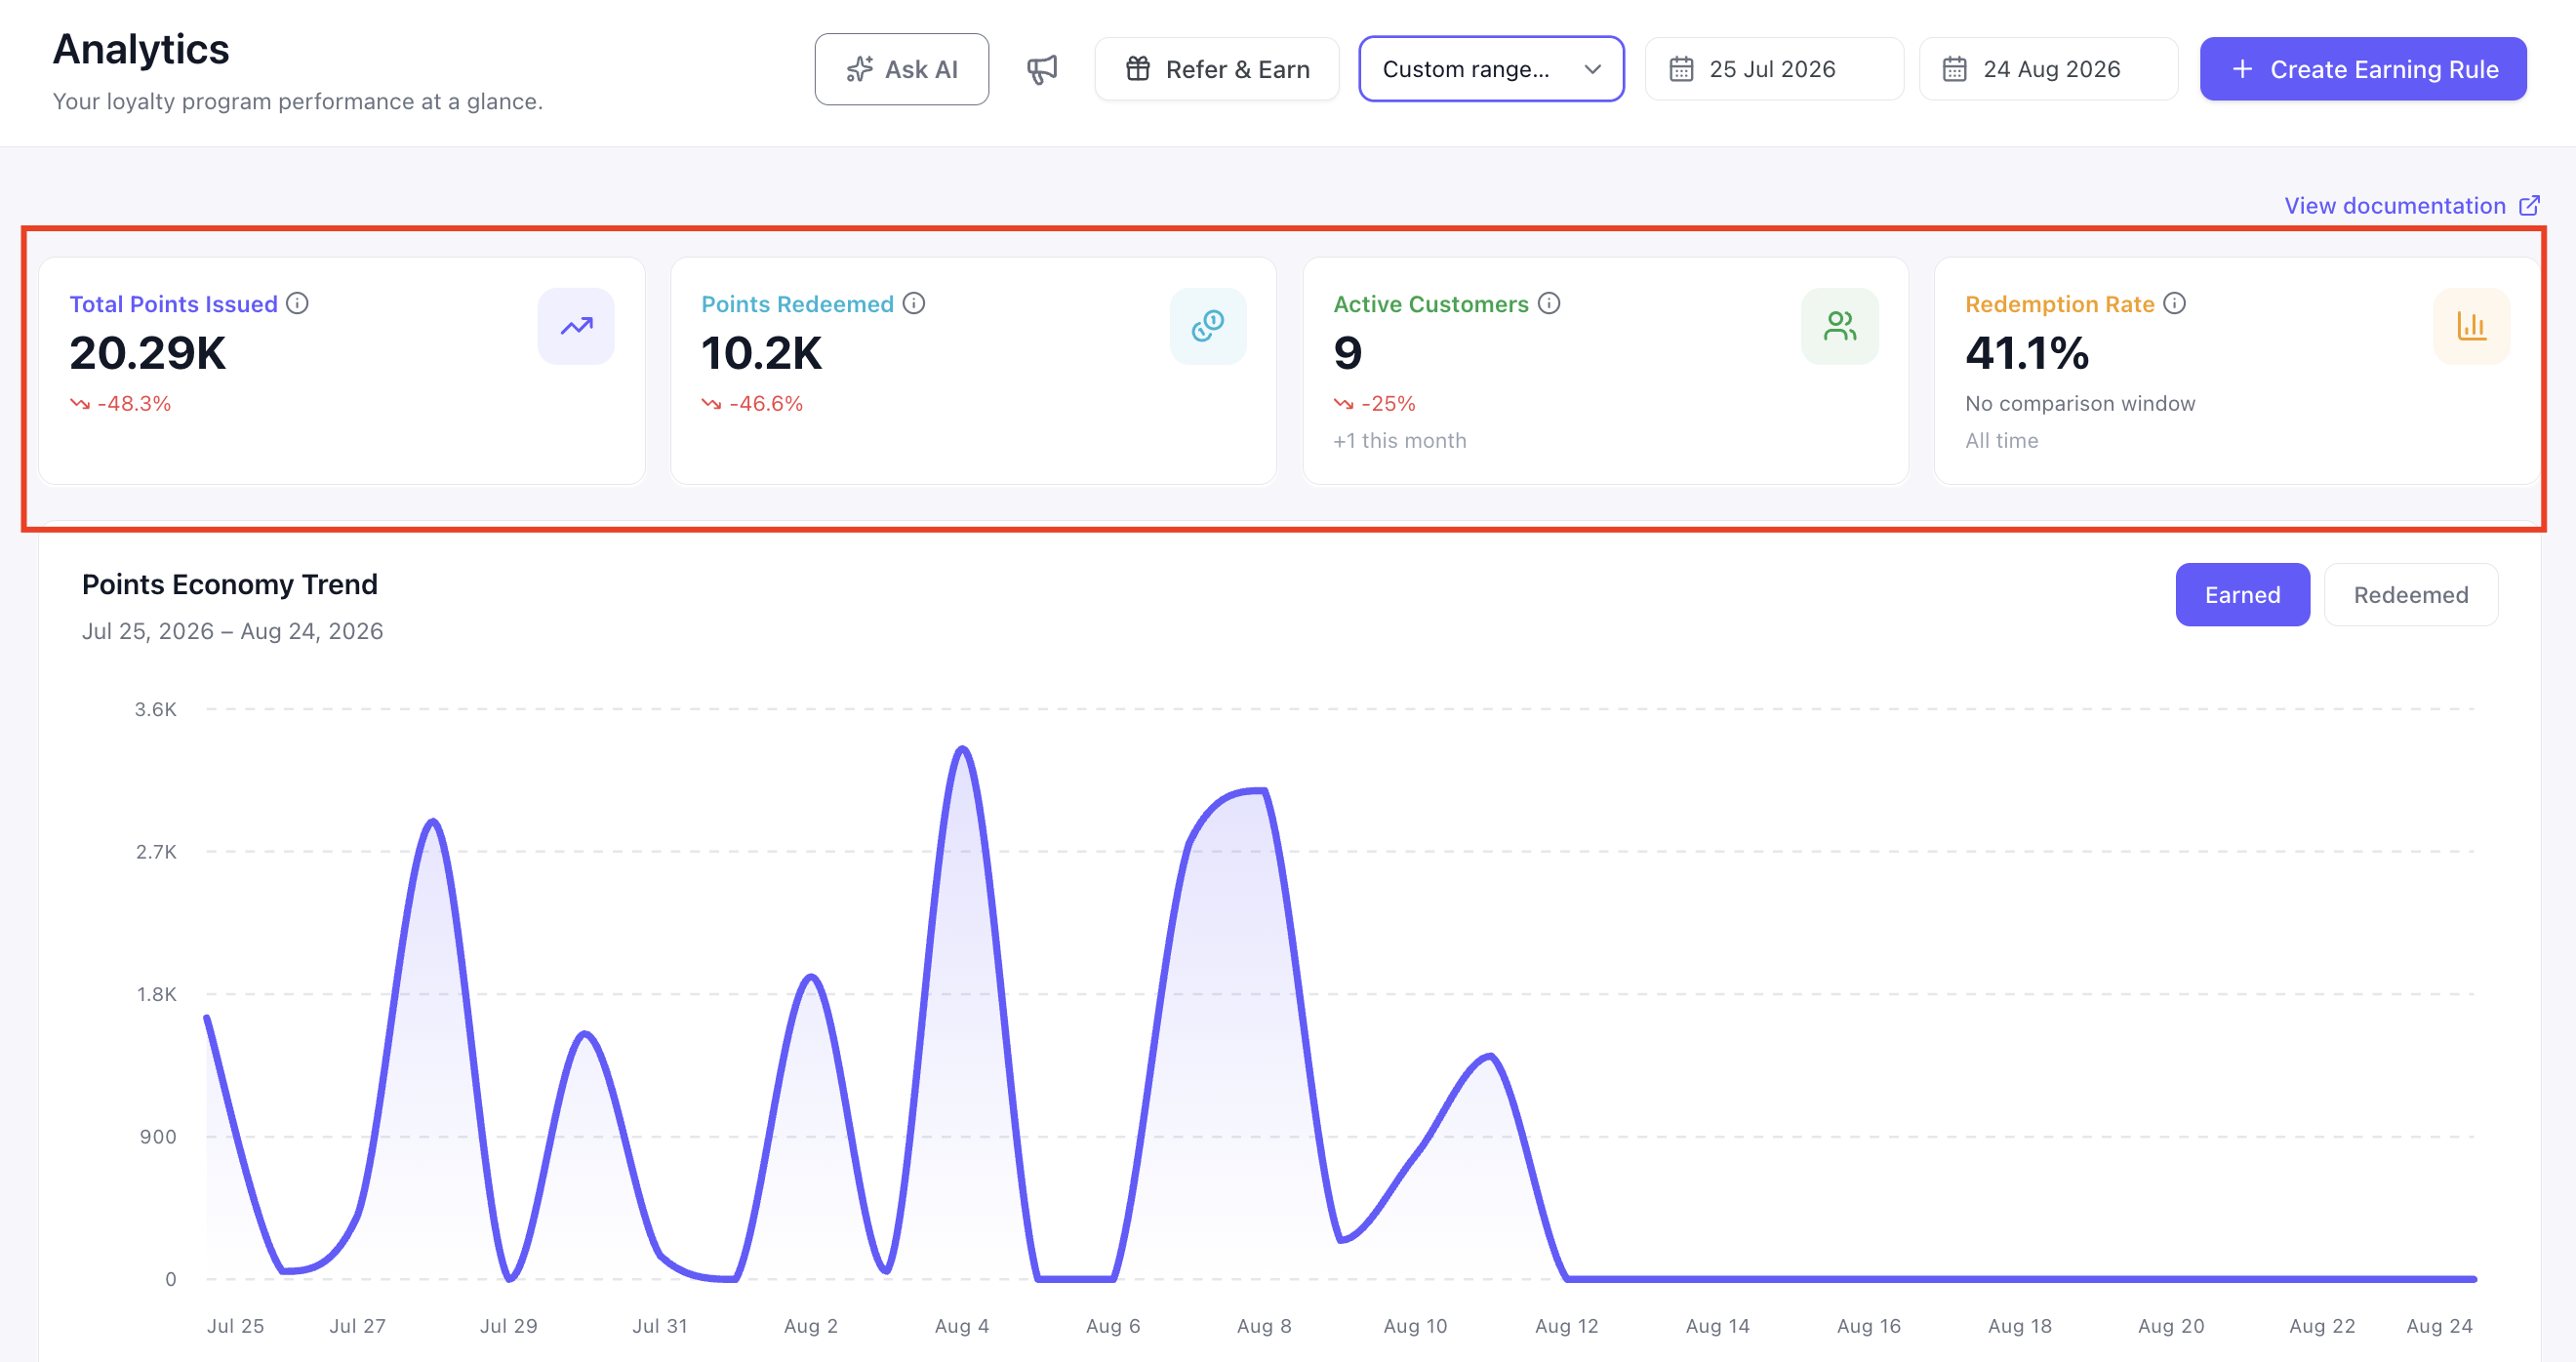
| Card | Shows | Note |
|---|---|---|
| Total Points Issued | Points awarded during the selected period | Includes a change compared with the previous period |
| Points Redeemed | Points spent during the selected period | Includes a change compared with the previous period |
| Active Customers | Customers active during the selected period | Includes a “+N this month” sub-note |
| Redemption Rate | Redeemed points as a share of issued points | Always all-time and does not follow the selected date range |
The Redemption Rate card always uses all-time data. It displays an All Time label so it is not confused with cards that follow the selected date range.
Point totals are displayed in compact form, such as 12.4K, while customer counts are shown as exact numbers.
Step 3: Read the Trend Chart #
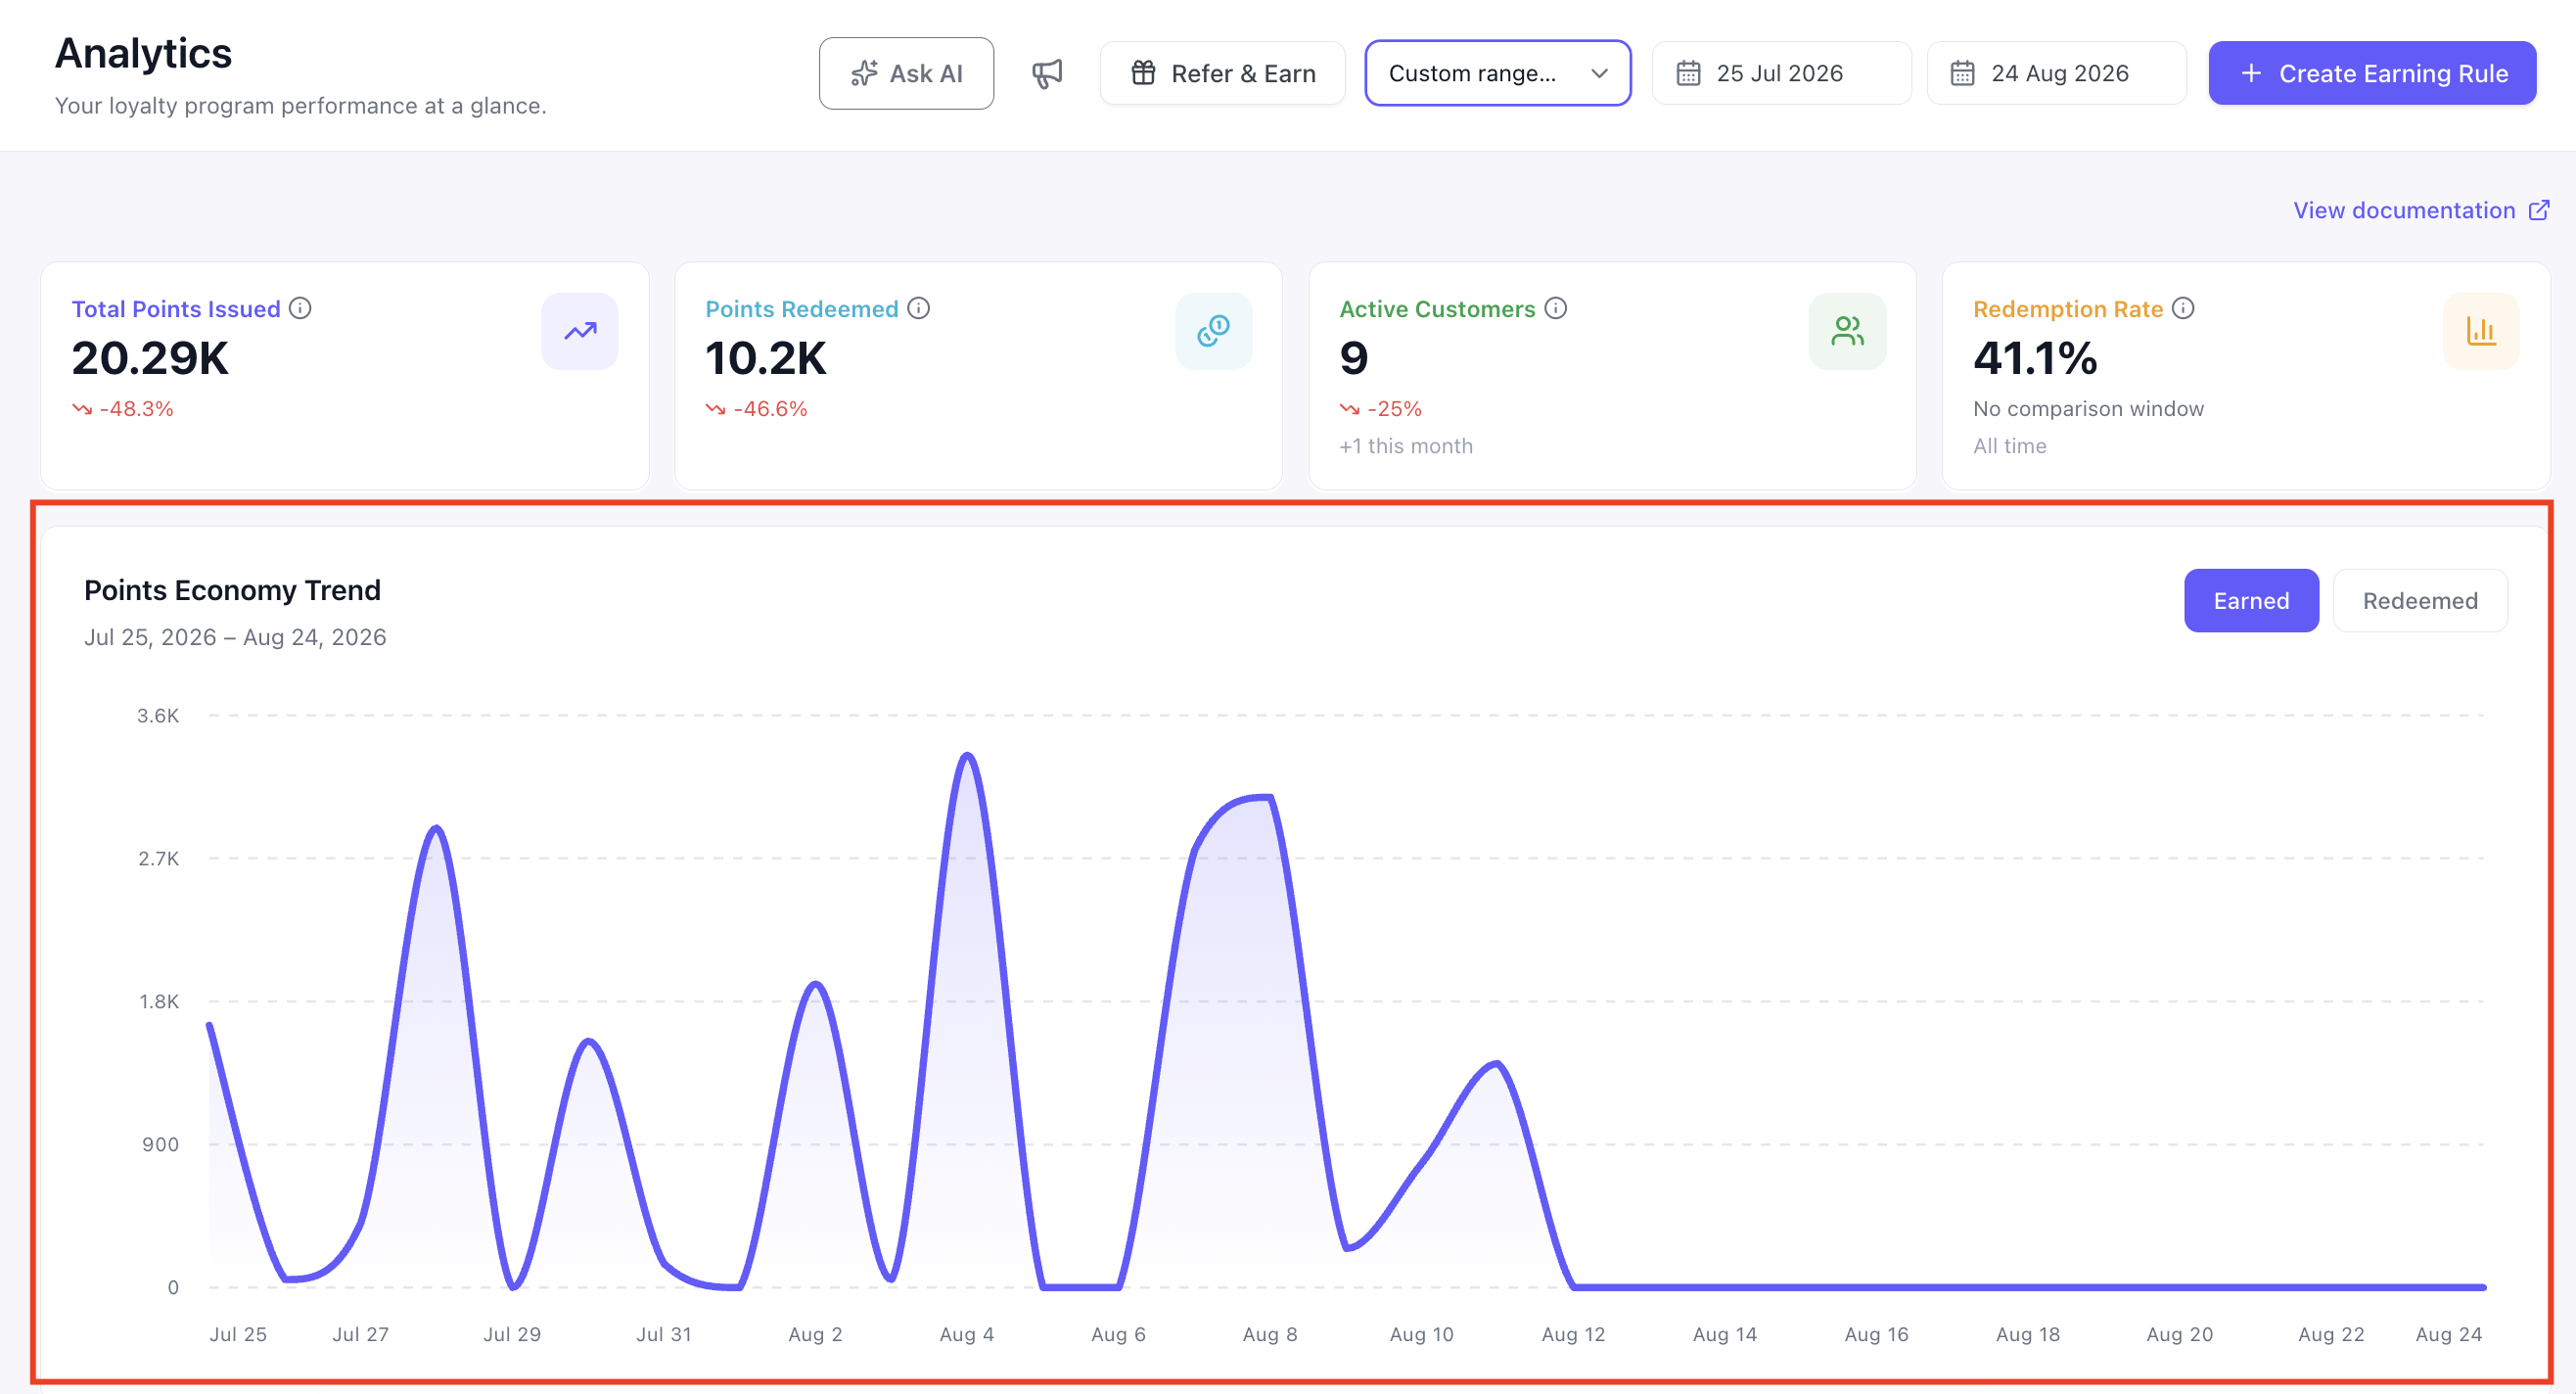
Use the tabs above the chart to switch between Earned, Redeemed, and any additional series recorded by your site.
| Selected Period | Chart Grouping |
|---|---|
| 1 month or less | Daily |
| More than 1 month and up to 6 months | Weekly |
| More than 6 months | Monthly |
| All Time | Monthly |
Step 4: Read the Six Widgets #
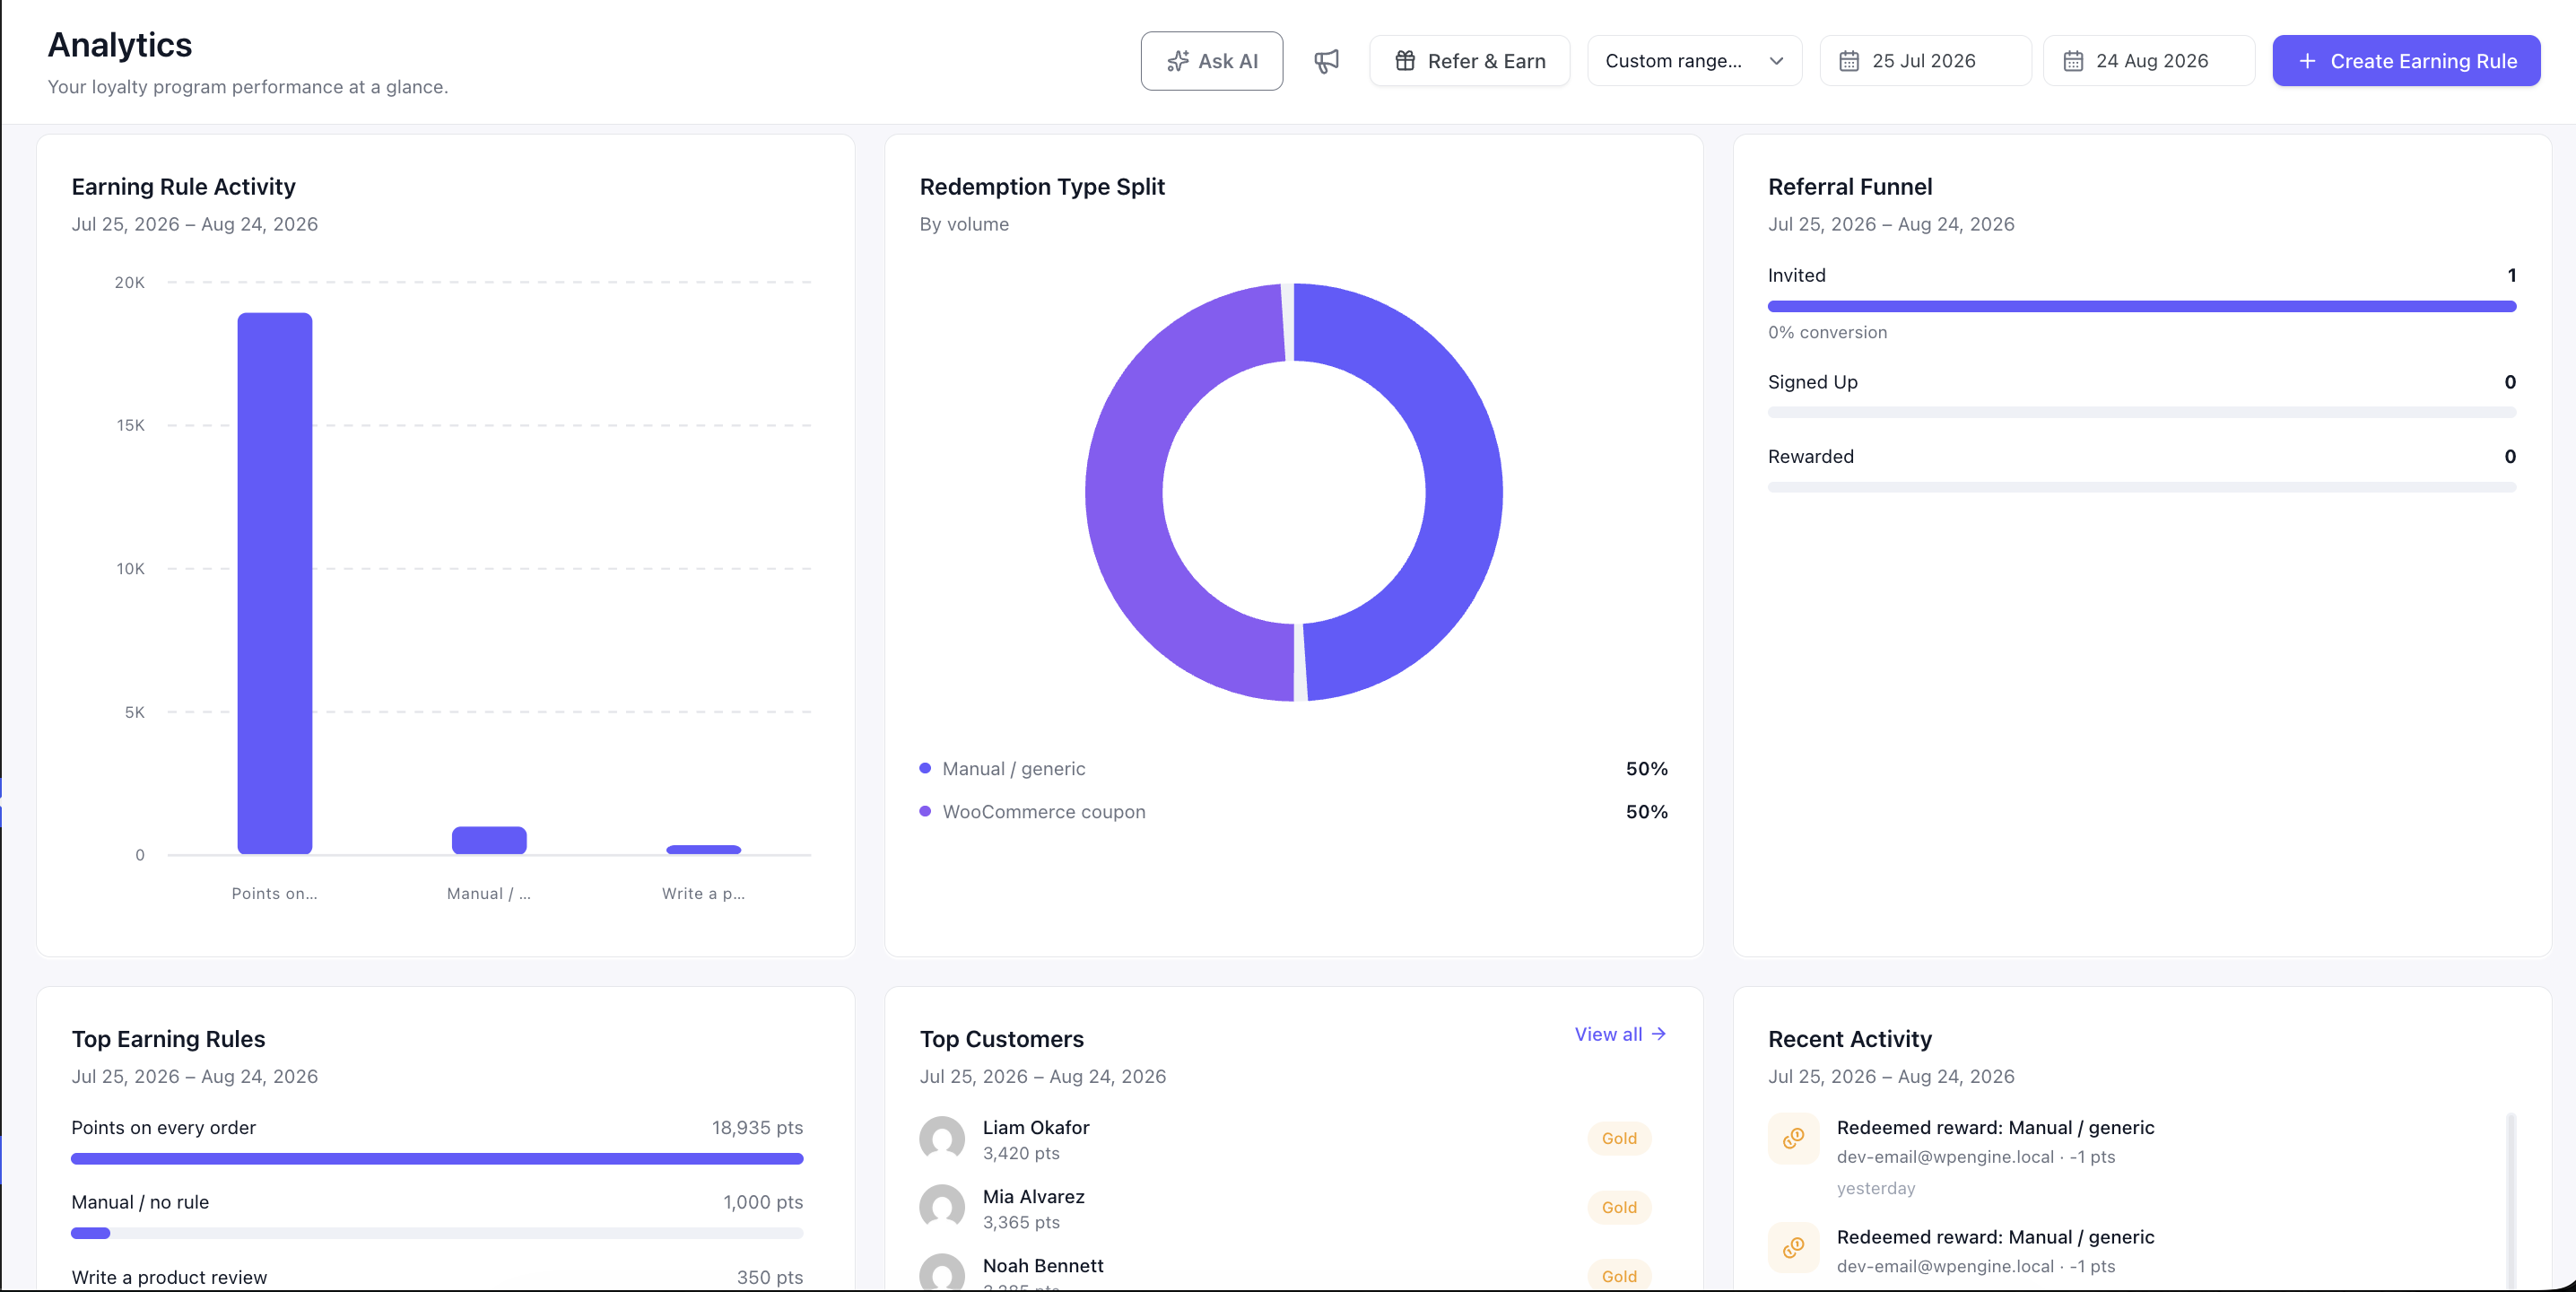
| Widget | Title | Empty Message |
|---|---|---|
| Rule Activity Chart | Earning Rule Activity | “No rule earned points in this range.” |
| Redemption Donut | Redemption Type Split — By volume | “Nothing has been redeemed in this range.” |
| Referral Funnel | Referral Funnel | Never empty; each stage displays zero when there is no referral activity |
| Top Rules List | Top Earning Rules | “No points earned yet” with a supporting explanation |
| Top Customers | Top Customers | “No customers yet” with a supporting explanation and a View All link |
| Activity Feed | Recent Activity | “Nothing has happened yet” with a supporting explanation |
The Referral Funnel intentionally does not use an empty state. If there are no referrals during the selected period, each stage displays zero because zero is still meaningful data.
Step 5: Act on What You See #
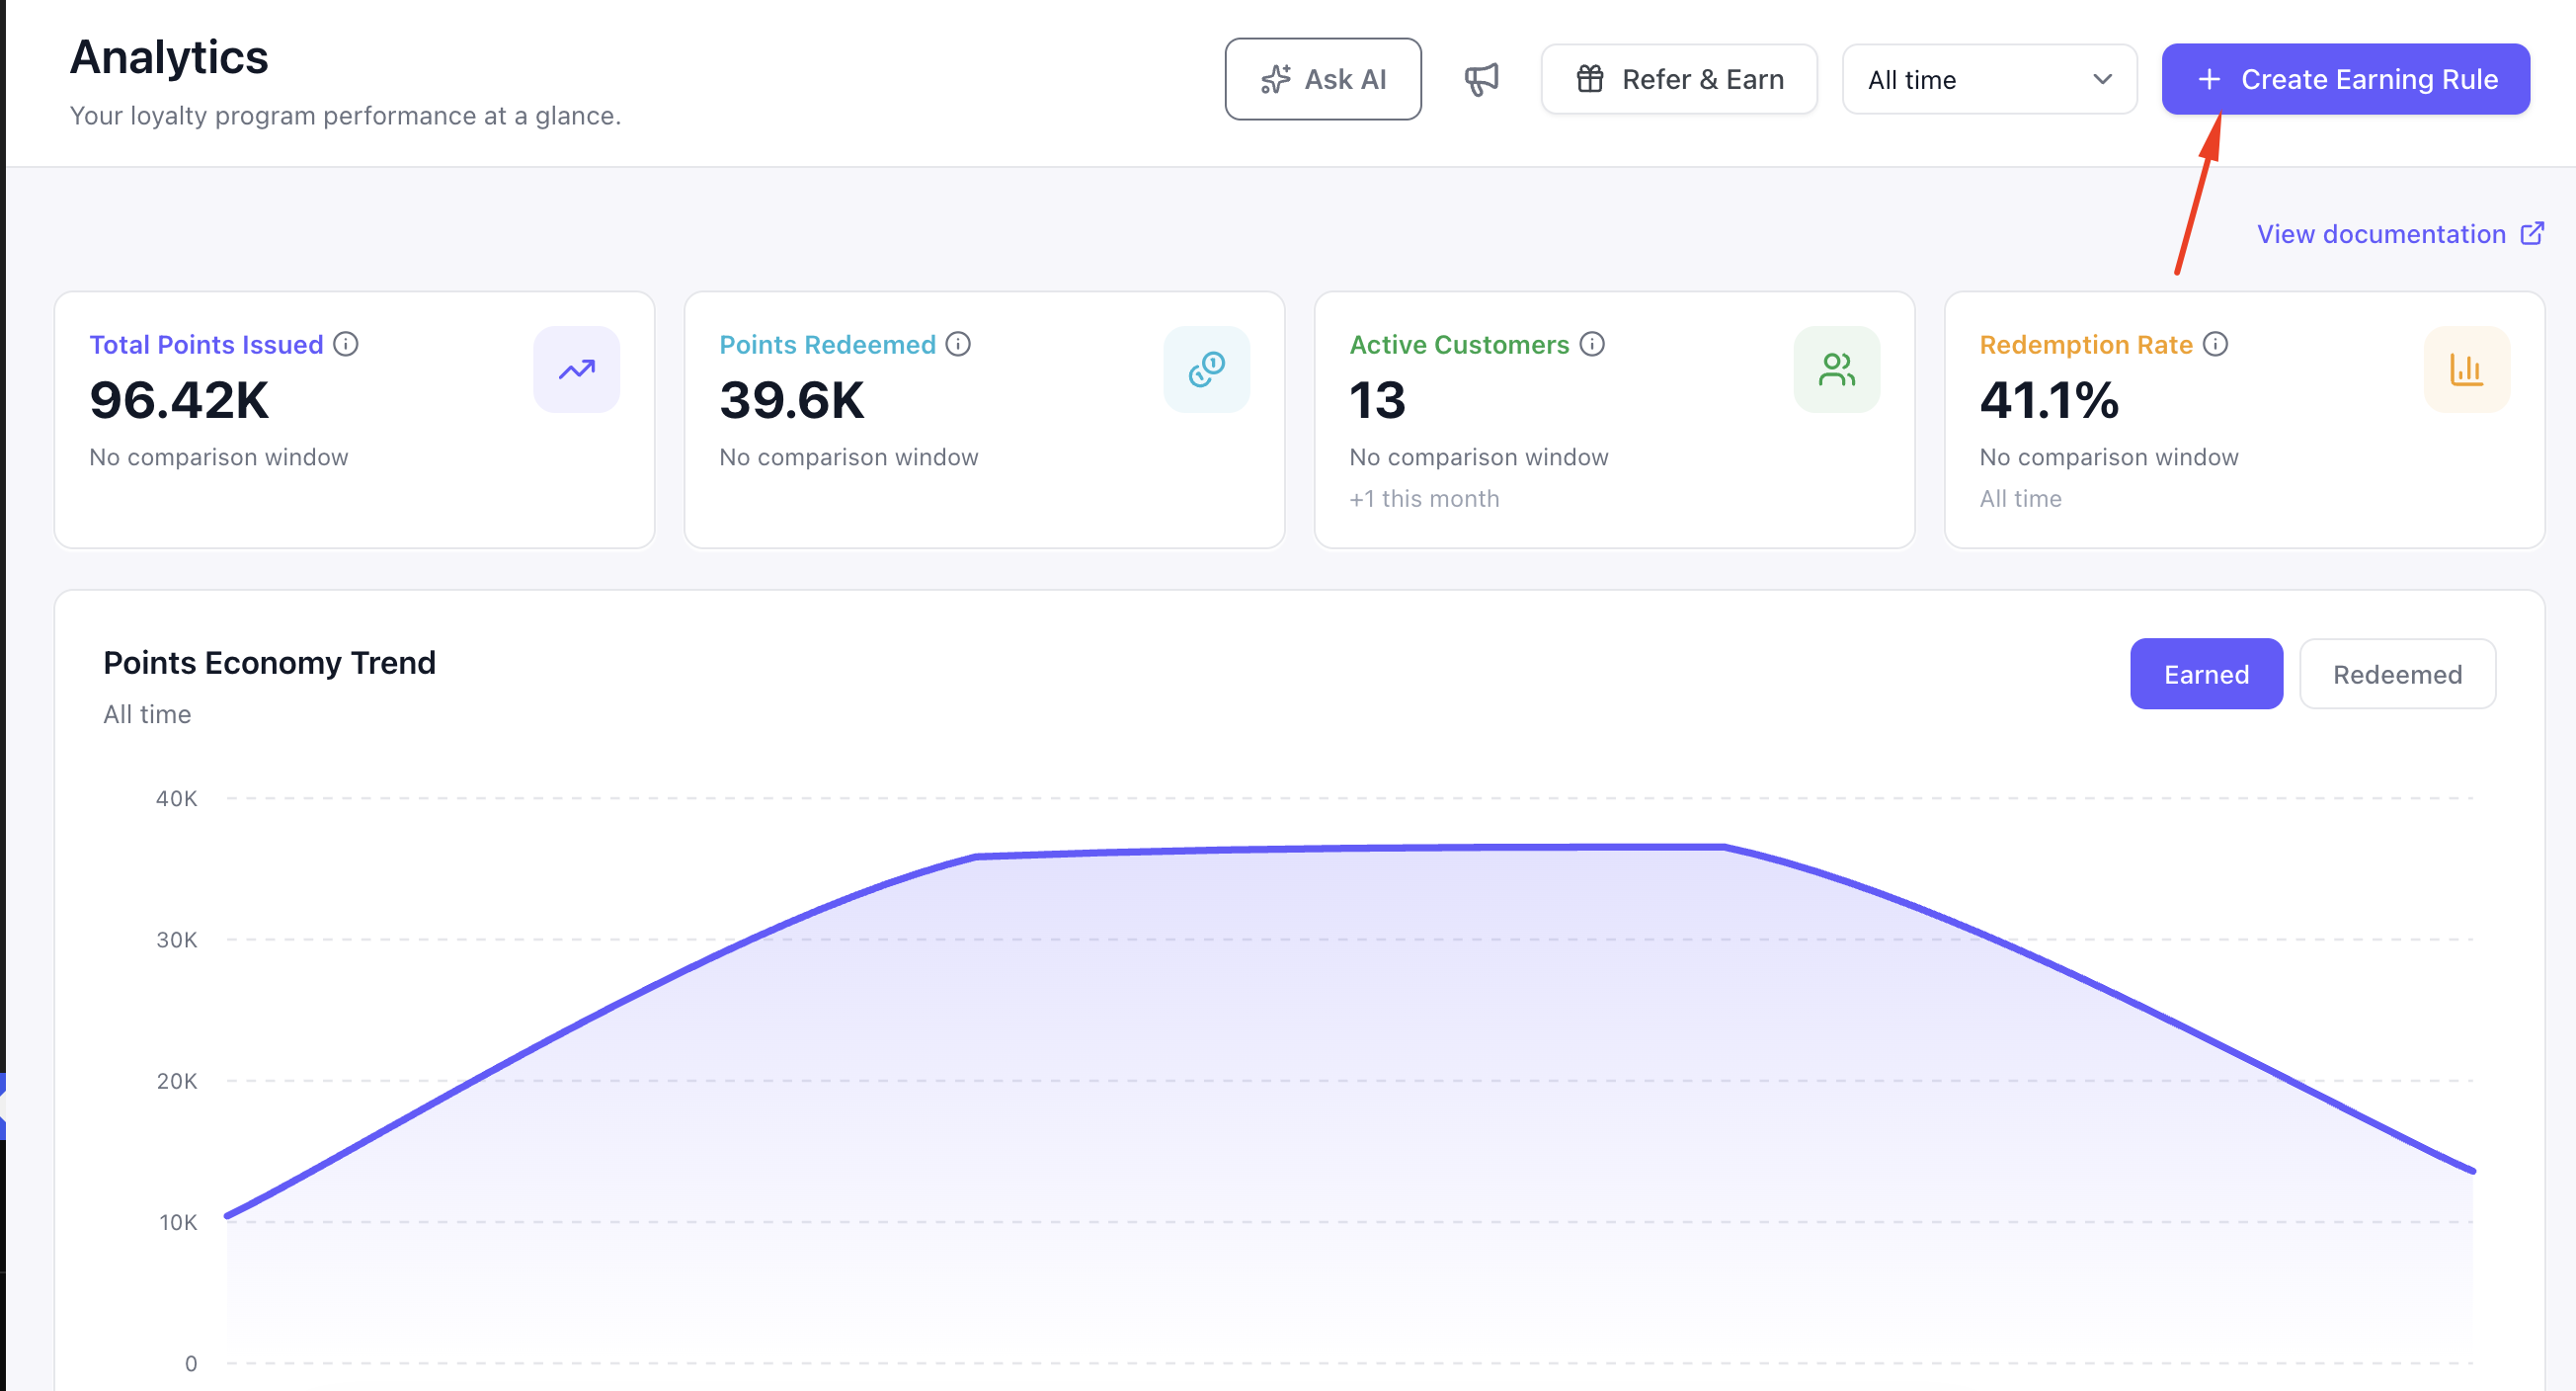
Click Create Rule in the header to open the Points Program editor.
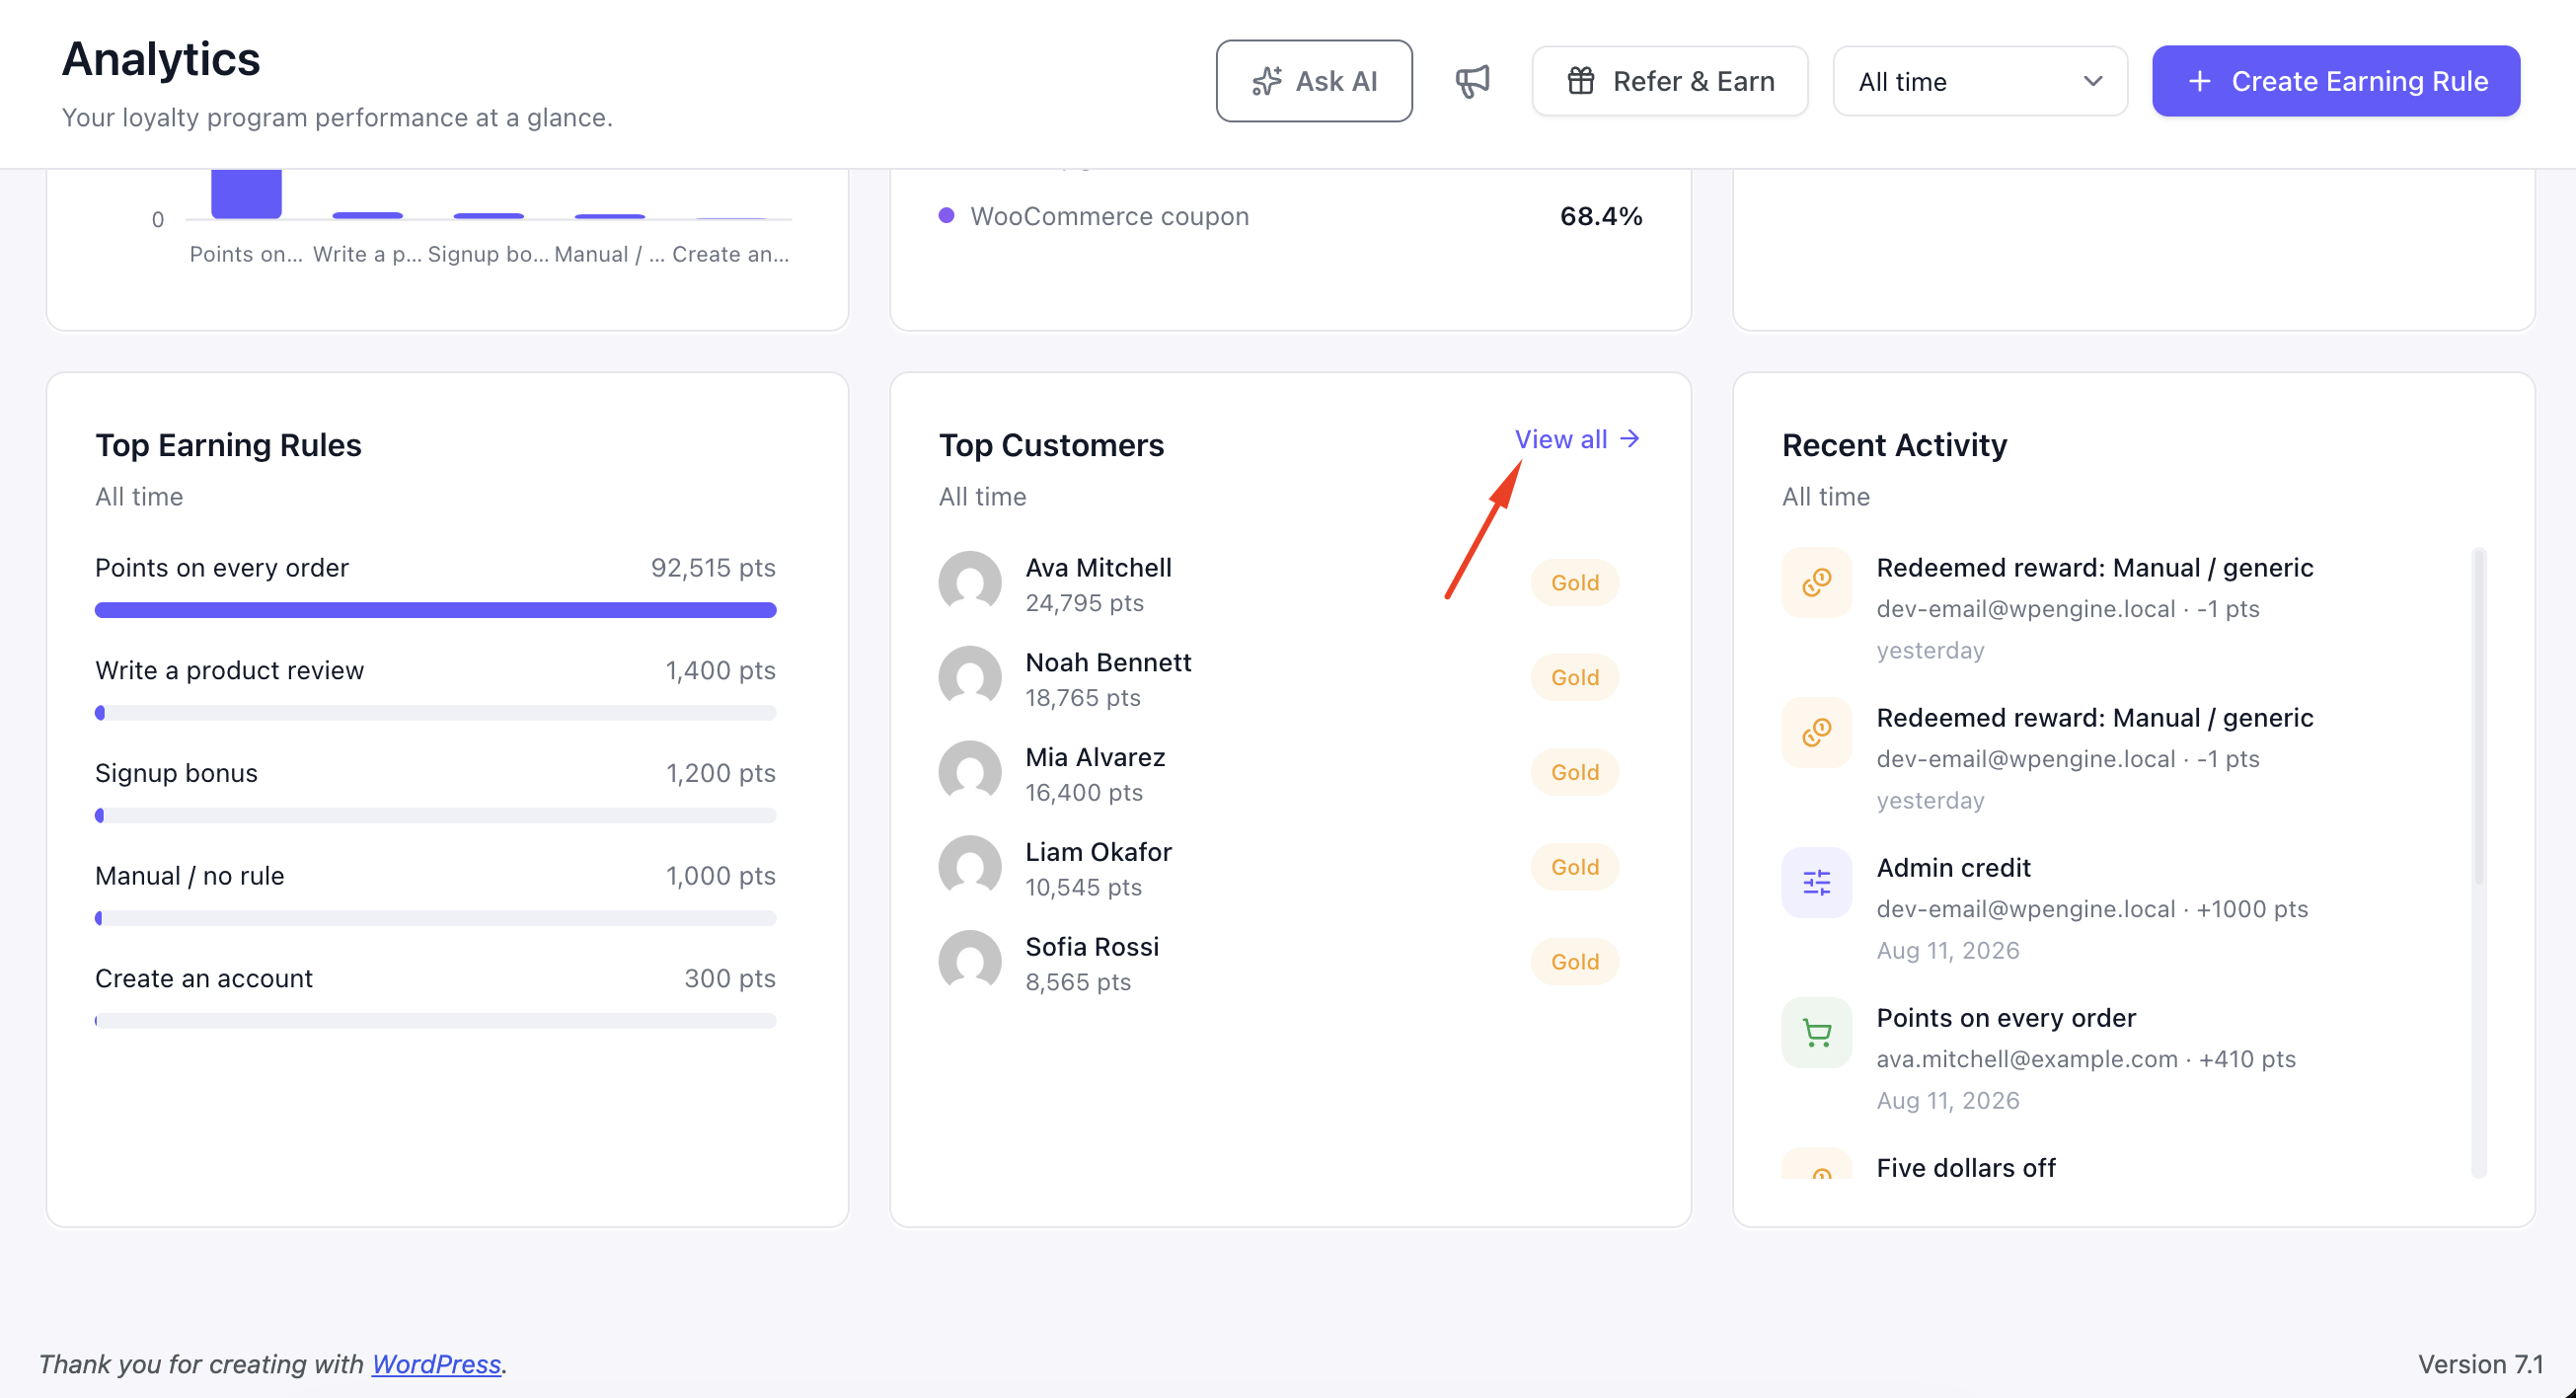
Use the View All link in the Top Customers widget to open the Customers screen.
Key Functionality #
Analytics data is cached for a short period to keep the dashboard responsive. The cached values are refreshed in the background, so a newly created transaction may not appear immediately.
| Widget | Refresh Interval |
|---|---|
| Recent Activity | Every minute |
| Everything Else | Every 5 minutes |
How a Widget Loads #
Each Analytics widget follows this loading process:
- Open the Analytics screen.
- Pointics resolves the selected date range.
- The dashboard sends requests for the six widgets.
- If fresh cached data is available, it is displayed immediately.
- If slightly stale cached data is available, it is shown immediately while Pointics refreshes it in the background.
- If no cached data exists, Pointics calculates the figures immediately.
- The calculated result is cached and displayed.
- If a widget has no matching data, it shows its own empty-state message.
- If data exists, Pointics displays the appropriate chart or list.
Validation Rules #
- The date range must be one of the eight supported options or a valid custom range.
- For custom ranges, the To date cannot come before the From date.
- If either custom date is missing, the range is not applied and the headings display “Pick both dates.”
- Top Earning Rules displays up to 20 entries.
- Top Customers displays up to 50 entries.
- Recent Activity displays up to 50 entries.
“Unknown analytics range.”
Limitations #
- Redemption Rate does not follow the selected date range. It always uses all-time data.
- Analytics figures are cached, so new transactions may take a few minutes to appear.
- A period with no activity displays the widget’s empty state instead of a flat zero line.
- Analytics is read-only and does not provide an export option.
- Use the Transactions or Customers screens when you need exportable data.
- The Referral Funnel remains at zero until referrals have activity.
- Last 12 Months is aligned to the same day of the month and is not identical to a fixed rolling-day range.
Troubleshooting #
| Problem | Solution |
|---|---|
| “Unknown analytics range.” | The selected range is not one of the supported options. Reset the date-range selector. |
| An invalid date message appears. | Check the date format and confirm that the end date does not come before the start date. |
| Card headings display “Pick both dates.” | A custom range has only one date selected. Set both the From and To dates. |
| Numbers look outdated. | Analytics data is cached for a few minutes. Wait briefly and reload the page. |
| Redemption Rate does not match the selected date range. | This card always uses all-time data. Check the All Time label. |
| Everything appears empty on an active site. | Check that the selected date range includes the relevant activity and confirm that the Transactions screen contains completed transactions. |
| The Referral Funnel shows all zeroes. | No referral activity occurred during the selected period. This is expected. |
| One widget continues loading. | Wait about a minute and reload. A slow calculation should clear itself. |
| The chart grouping looks incorrect. | The grouping is selected automatically based on the length of the reporting period. |
| Top Earning Rules under-reports older data. | Sites upgraded from an earlier version may not have rule attribution stored on historical transactions. Contact support if historical attribution needs to be restored. |
Notes #
- The change shown on each stat card compares the selected period with the immediately preceding period of the same length.
- The Earning Rule Activity chart and Top Earning Rules list use the same underlying figures, so they should always agree on whether rule data exists.


