Restaurant Sales Report With AI: Turn Data Into Better Decisions


Table of Contents
It’s Monday morning. Last week felt busy, the Friday rush ran late, and the kitchen barely caught its breath. But did revenue actually grow? Which dishes carried the week? Where did orders slow down? Answering that usually means checking several screens.
A restaurant sales report puts those answers in one place: your revenue, orders, best sellers, and bookings, compared with the week before. Reviewing it weekly lets you act before the next rush.
If your restaurant runs on WordPress, WPCafe MCP lets an AI assistant pull those numbers when you ask. This guide shows what to track, how to run a quick weekly review, and how to turn the results into action.
How Can AI Help With Restaurant Sales Reports?
AI helps with restaurant sales reports by turning your revenue, orders, reservations, and best-selling menu items into simple answers. When connected to your restaurant data, it reduces manual report checking and helps you quickly see what changed, while you decide what action to take.
If you’re new to this approach, it helps to first understand how AI fits into WordPress restaurant managementand what you can actually use it for.
For example, instead of opening multiple screens and comparing numbers manually, you can ask, “How did we perform this week?” and get a quick summary of your sales performance.
What Should a Weekly Restaurant Sales Report Include?
A useful weekly restaurant sales report should focus on the numbers that help you understand your performance and decide what to improve. You don’t need every metric, just the ones that show how demand changed during the week.
The sales numbers to review every week
- Total revenue: See how much your restaurant earned and compare it with previous weeks.
- Order count: Understand whether sales changed because you received more orders or because customers spent more per order.
- Average order value (AOV): Track how much customers spend on average and identify changes in buying behavior.
- Best-selling menu items: Find which dishes are driving sales and deserve more attention.
- Slow-moving items: Identify menu items that sell less and may need promotion or review.
- Order types: Compare dine-in, delivery, and pickup performance if your restaurant offers multiple ordering options.
- Reservations: Review upcoming bookings, pending reservations, and customer demand.
- Discount usage: Understand which promotions customers used and how they affected orders.
Your restaurant sales data covers the demand side well. Cost metrics like labor, food cost, and prime cost matter just as much, but they live in your POS, payroll, or accounting tools. We cover that gap in What AI Sales Reports Cannot Tell You.

3 Ways to Build a Restaurant Sales Report
The goal isn’t a prettier report. It’s getting restaurant sales insights fast enough to act on them: spotting that a dish is taking off, that a weekday is going quiet, or that bookings are piling up unconfirmed. Here are three ways to get there, each with honest trade-offs.
Option 1: Use your restaurant sales dashboard in WPCafe
If your restaurant runs on WordPress with WPCafe, you already have a restaurant sales dashboard. It shows food order revenue, reservation revenue, a “since last period” comparison, recent food orders with their status, your reservation list, and top-selling items.
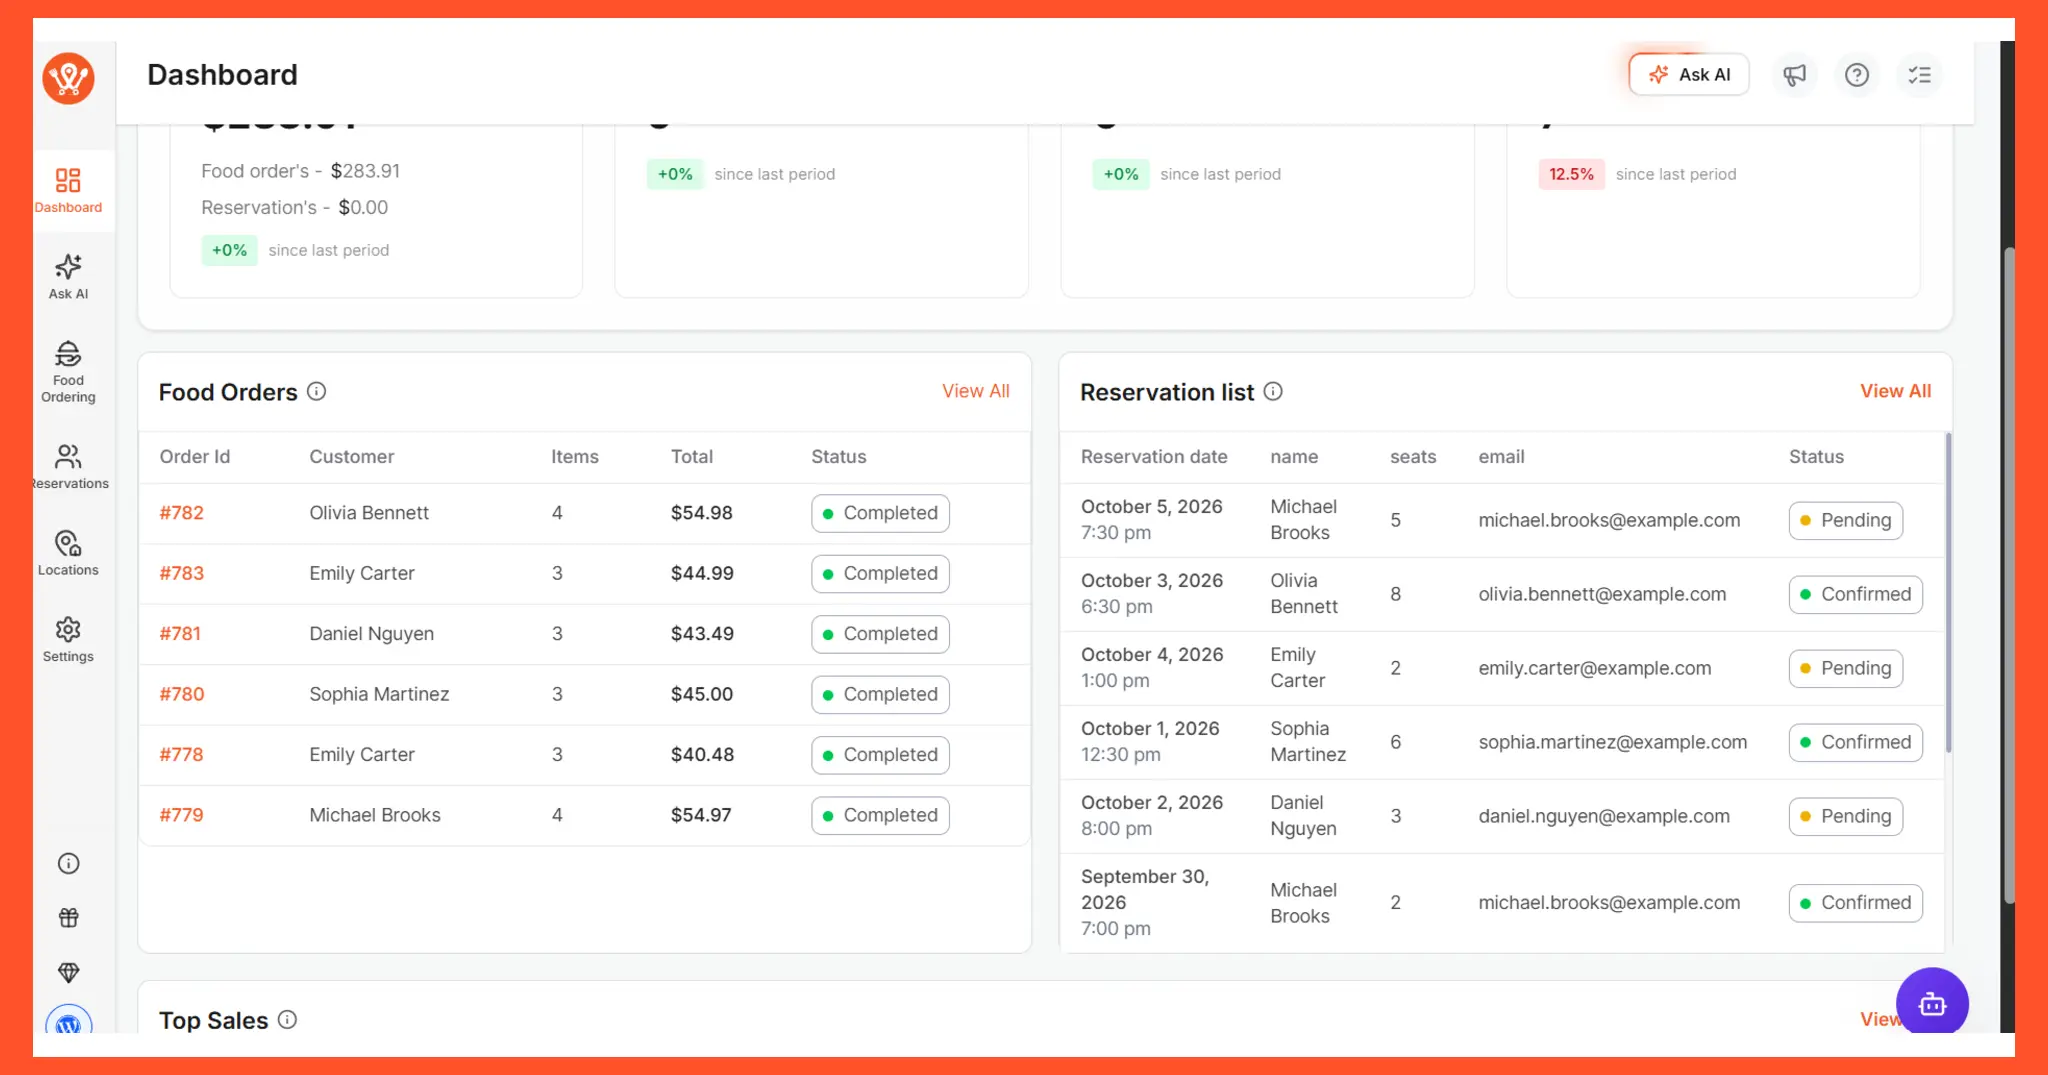
This is the fastest place to start, and it costs nothing extra. The limitation is that you do the analysis yourself. Answering “what changed this week and why does it matter” means moving between the dashboard, the orders screen, the reservations list, and the reports page, then comparing the numbers in your head or on paper.
Option 2: Export data into ChatGPT or Claude
Many owners export their orders as a CSV file and upload it to an AI chat tool with a question like “Which items sold best this week?” This gives you flexible, plain-language analysis without learning a reporting tool.
The catch is the routine work around it. You have to:
- export the file every time
- remove customer names and emails before uploading
- remember that the data is a snapshot from the moment you exported it
Weekly, that becomes one more chore, and it’s easy to skip.
Option 3: Connect AI to live data with MCP
MCP (Model Context Protocol) is an open standard that lets an AI assistant connect directly to another system and request data through approved tools. For a WordPress restaurant, that means an assistant like Claude can ask your site for revenue, orders, best sellers, or pending reservations when you ask a question. There’s no exporting or uploading involved.
Access runs through a WordPress Application Password tied to your user account, so the AI can only see and do what that account is allowed to. For how MCP works on a restaurant site, read our guide to AI restaurant management in WordPress.
Which option fits you?
| WPCafe dashboard | Export + AI tools | AI + MCP connection | |
|---|---|---|---|
| Data freshness | Live in WordPress admin | A snapshot from the time of export | Live data fetched on each request |
| Manual work | Open reports and compare by hand | Export, remove personal data, and upload each time | About 5 minutes of one-time setup, then ask questions |
| Ideal use case | Quick checks inside WordPress | Occasional one-off analysis | Recurring weekly reviews, Claude/Cursor/VS Code users, agencies managing several sites |
If you only glance at your numbers now and then, the dashboard is enough. If you want a repeatable weekly review without the export routine, the MCP connection is the better fit. The next section shows exactly how that review works.
How to Run a Weekly Restaurant Sales Review With WPCafe MCP
Once WPCafe MCP is connected, a weekly review becomes a short conversation with your AI assistant. You ask questions in plain language, and it fetches the answers from your restaurant site. The routine below takes the guesswork out of what to ask and when.
Note: We tested every prompt in this section on 29 September 2026. The setup was WPCafe 3.0 and WPCafe MCP 1.0, connected to Claude (Sonnet 5.5), on a demo restaurant site with 10 menu items, 6 food orders, and 7 table reservations. Every revenue, order, and reservation figure the AI returned matched the WPCafe dashboard and orders screen.
Before you start, you need four things:
- WPCafe: active on your WordPress site
- A WordPress user account: Shop Manager or Administrator role
- An MCP-compatible AI client: Claude Desktop, Cursor, or VS Code
- Node.js: version 18 or later on your computer
Setup is a one-time copy and paste of a small configuration block using a WordPress Application Password. Follow the WPCafe MCP setup guide for the exact steps, then come back here.
Step 1: Set a fixed review day and owner
Pick one day and one person. Monday morning works for most restaurants, because the weekend is fresh and the new week hasn’t started yet. The owner doesn’t have to be you. What matters is that someone runs the review every week, even when things are busy. A review that happens every week beats a detailed one that happens once a month.
Step 2: Get your weekly snapshot
Start with the big picture. Ask:
“Give me a sales overview for the last 7 days, including total revenue, total orders, and best-selling menu items.”
In our test, the AI returned this for 23 to 29 September:
| Metric | Result |
|---|---|
| Total revenue | $283.91 |
| Total orders | 6 (all completed) |
| Items sold | 20 |
| Average order value | $47.32 |
| Largest order | #782, $54.98 |
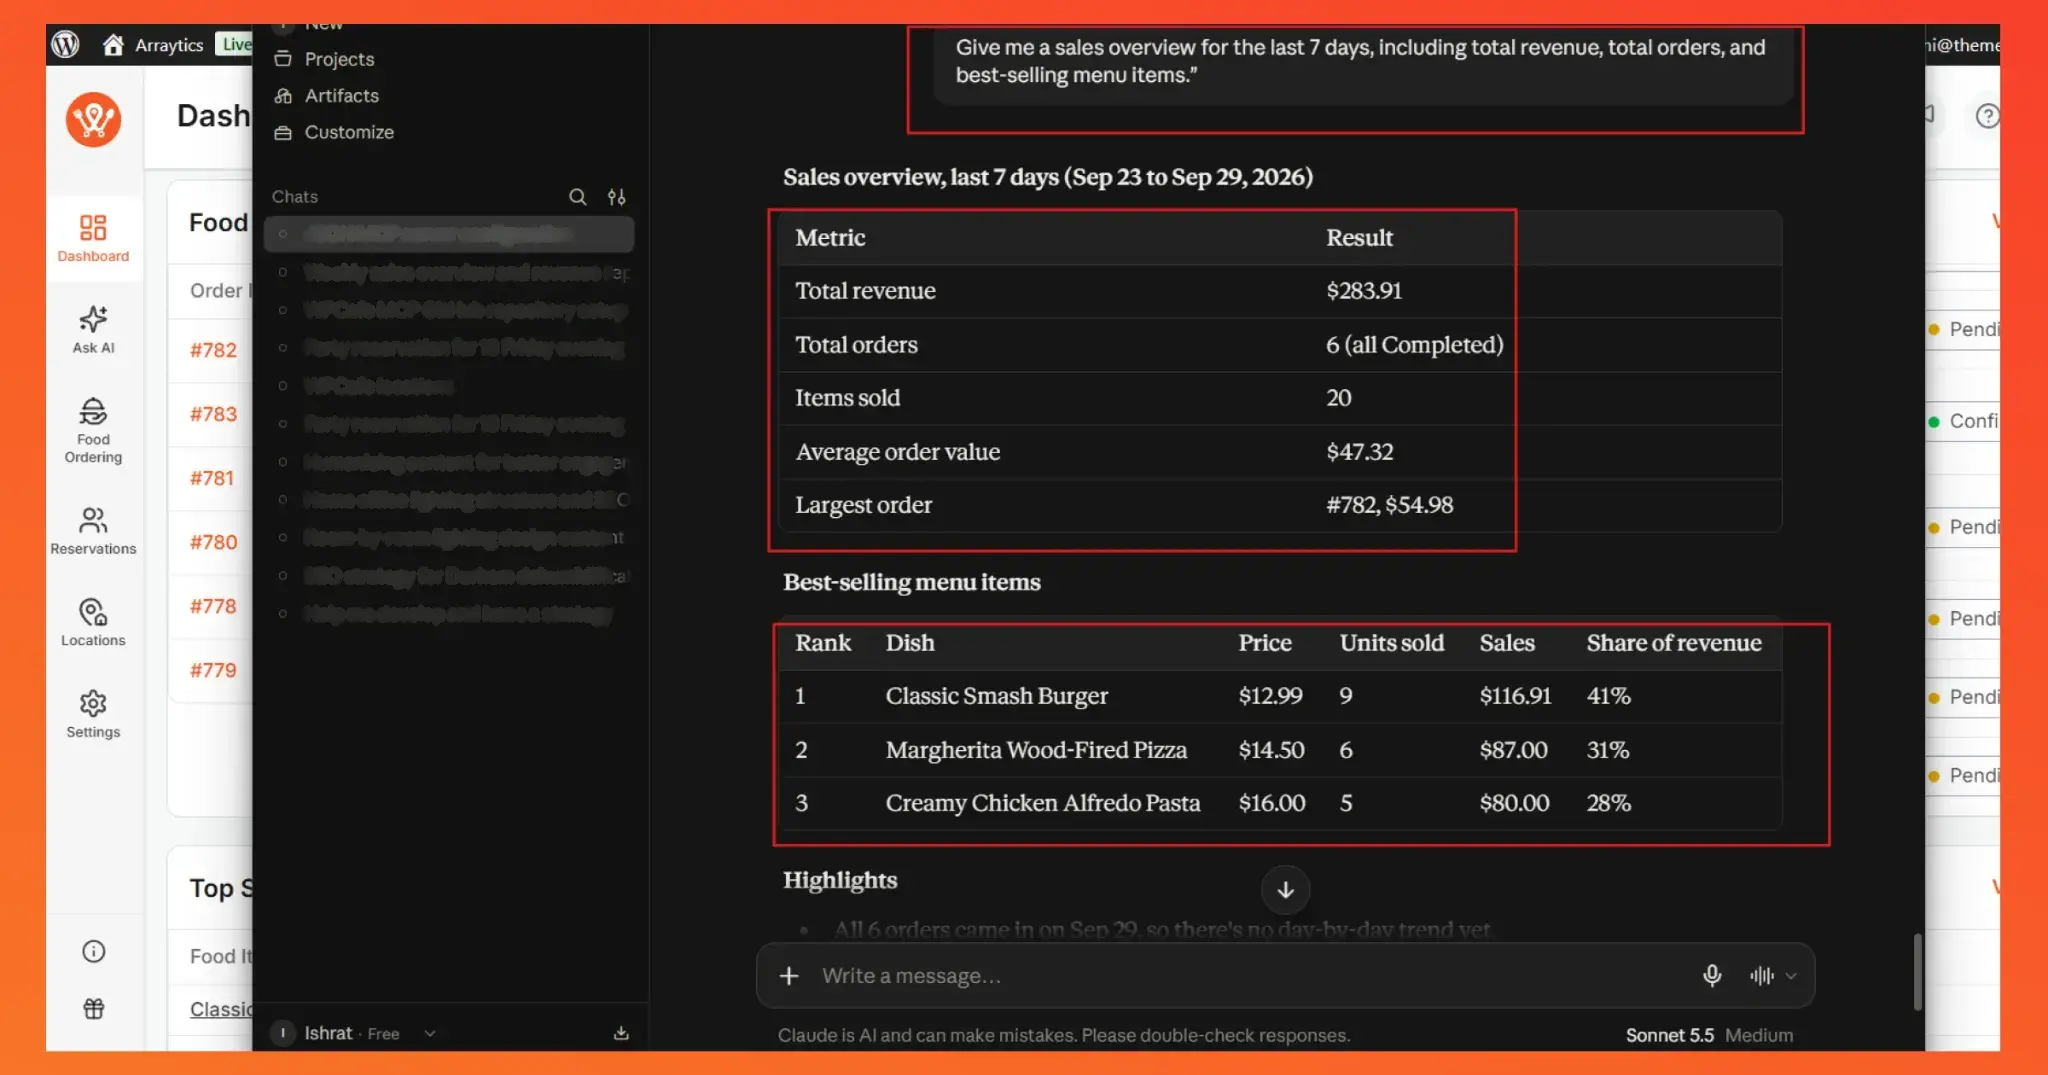
Every figure matched the WPCafe dashboard, where food order revenue showed $283.91, and the orders screen listed the same six completed orders.
The AI also noted that all six orders came in on the same day, so there was no day-by-day trend to report yet. That’s the kind of context a raw report won’t give you.
Step 3: Check your best-selling menu items
Next, find out which dishes carried the week:
“What were our best-selling menu items during the last 7 days? Show the items and their sales.”
Our test returned the top three items with units sold and revenue share:
| Rank | Dish | Price | Units sold | Sales | Share of revenue |
|---|---|---|---|---|---|
| 1 | Classic Smash Burger | $12.99 | 9 | $116.91 | 41% |
| 2 | Margherita Wood-Fired Pizza | $14.50 | 6 | $87.00 | 31% |
| 3 | Creamy Chicken Alfredo Pasta | $16.00 | 5 | $80.00 | 28% |
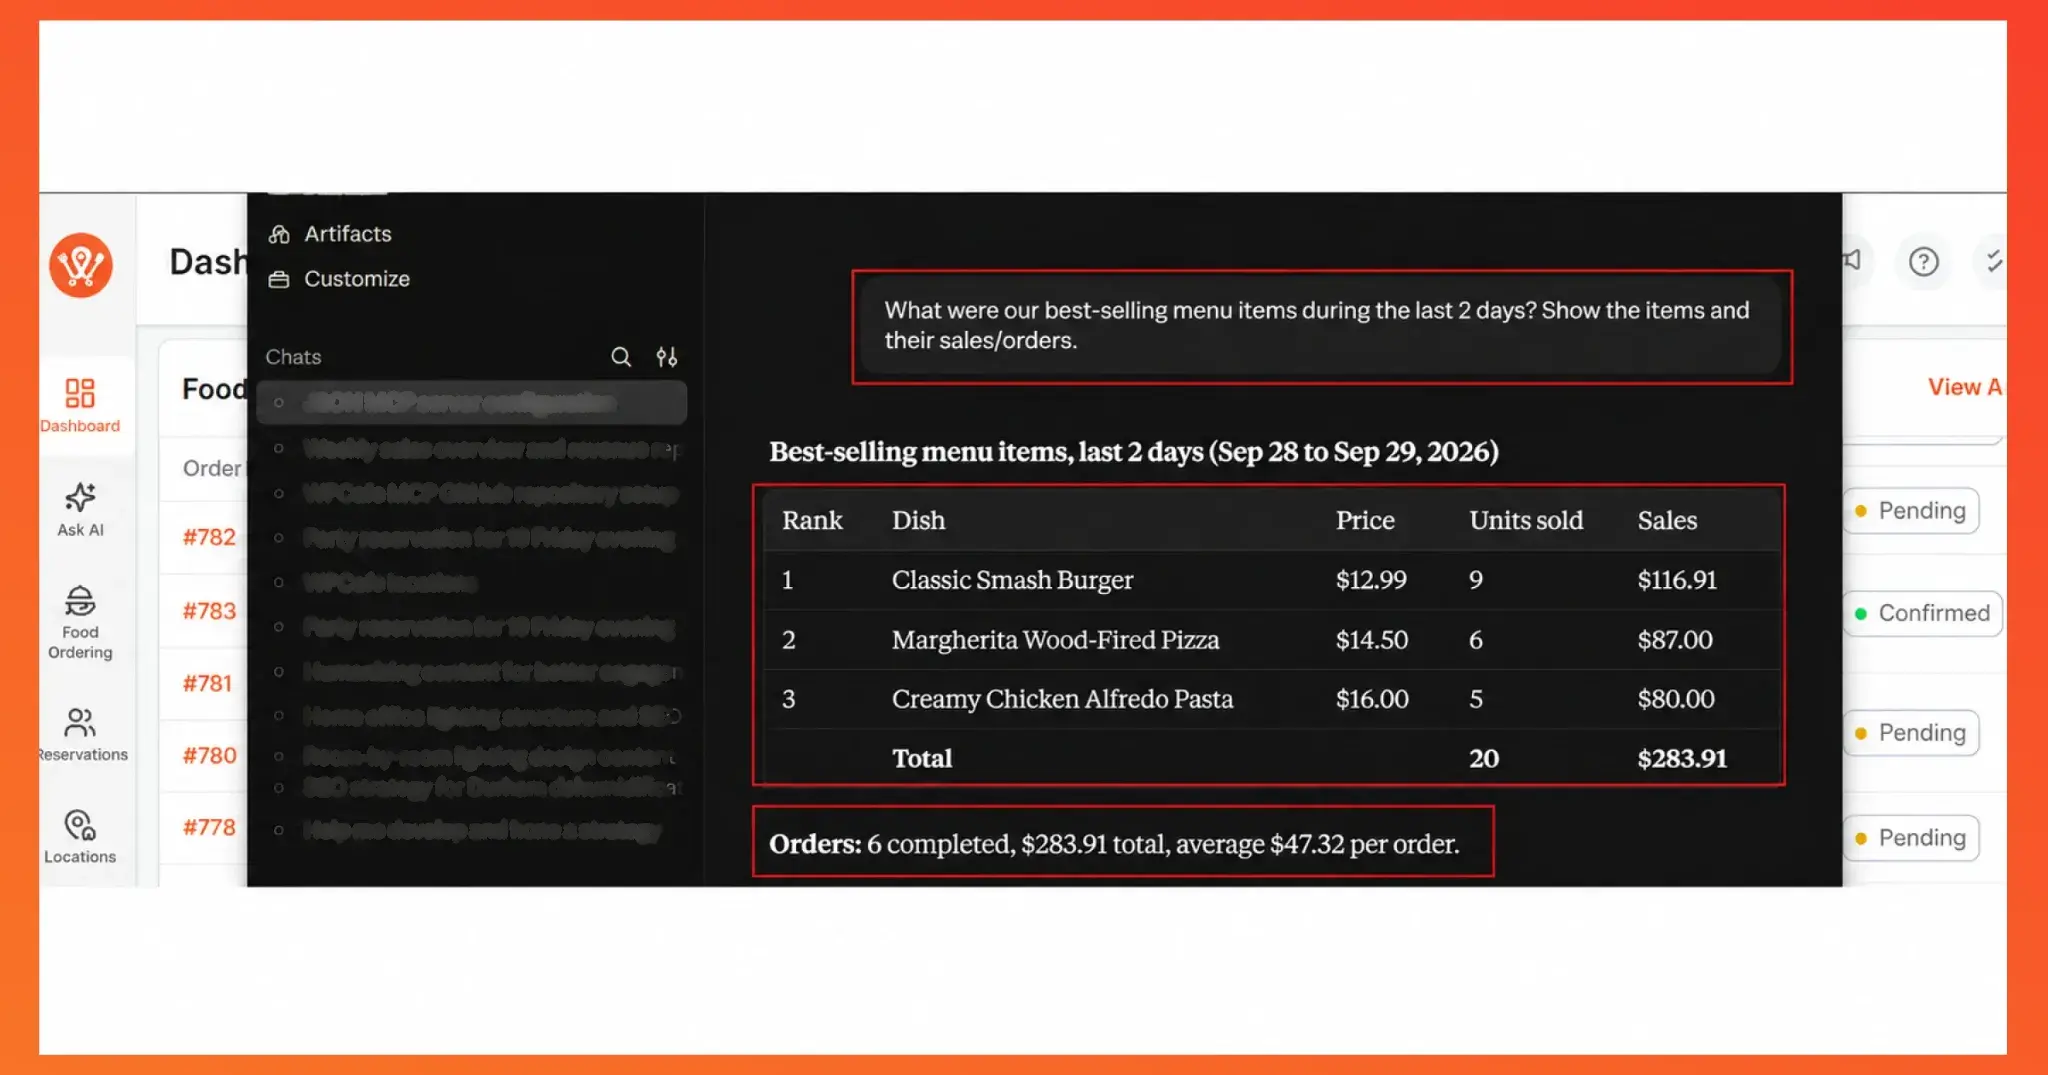
The prices matched the WPCafe products list, and the three rows add up to the same $283.91 and 20 items as the weekly snapshot. You can change the time range in plain language. Asking for “the last 2 days” returned the correct figures for that shorter period.
The revenue share column is the useful part. When one dish brings in 41% of your sales, you know what to protect: keep it in stock, keep it visible, and never let it run out on a Friday.
Step 4: Review order status and reservations
Sales numbers only tell part of the story. Unfinished orders and unconfirmed bookings are revenue at risk. Ask:
“Show me the current orders by status and list any pending reservations.”
In our test, the AI confirmed all 6 orders were completed, with none pending, processing, or cancelled. It then listed 4 pending reservations with dates, names, and party sizes, totalling 14 guests. It correctly left out the bookings that were already confirmed.
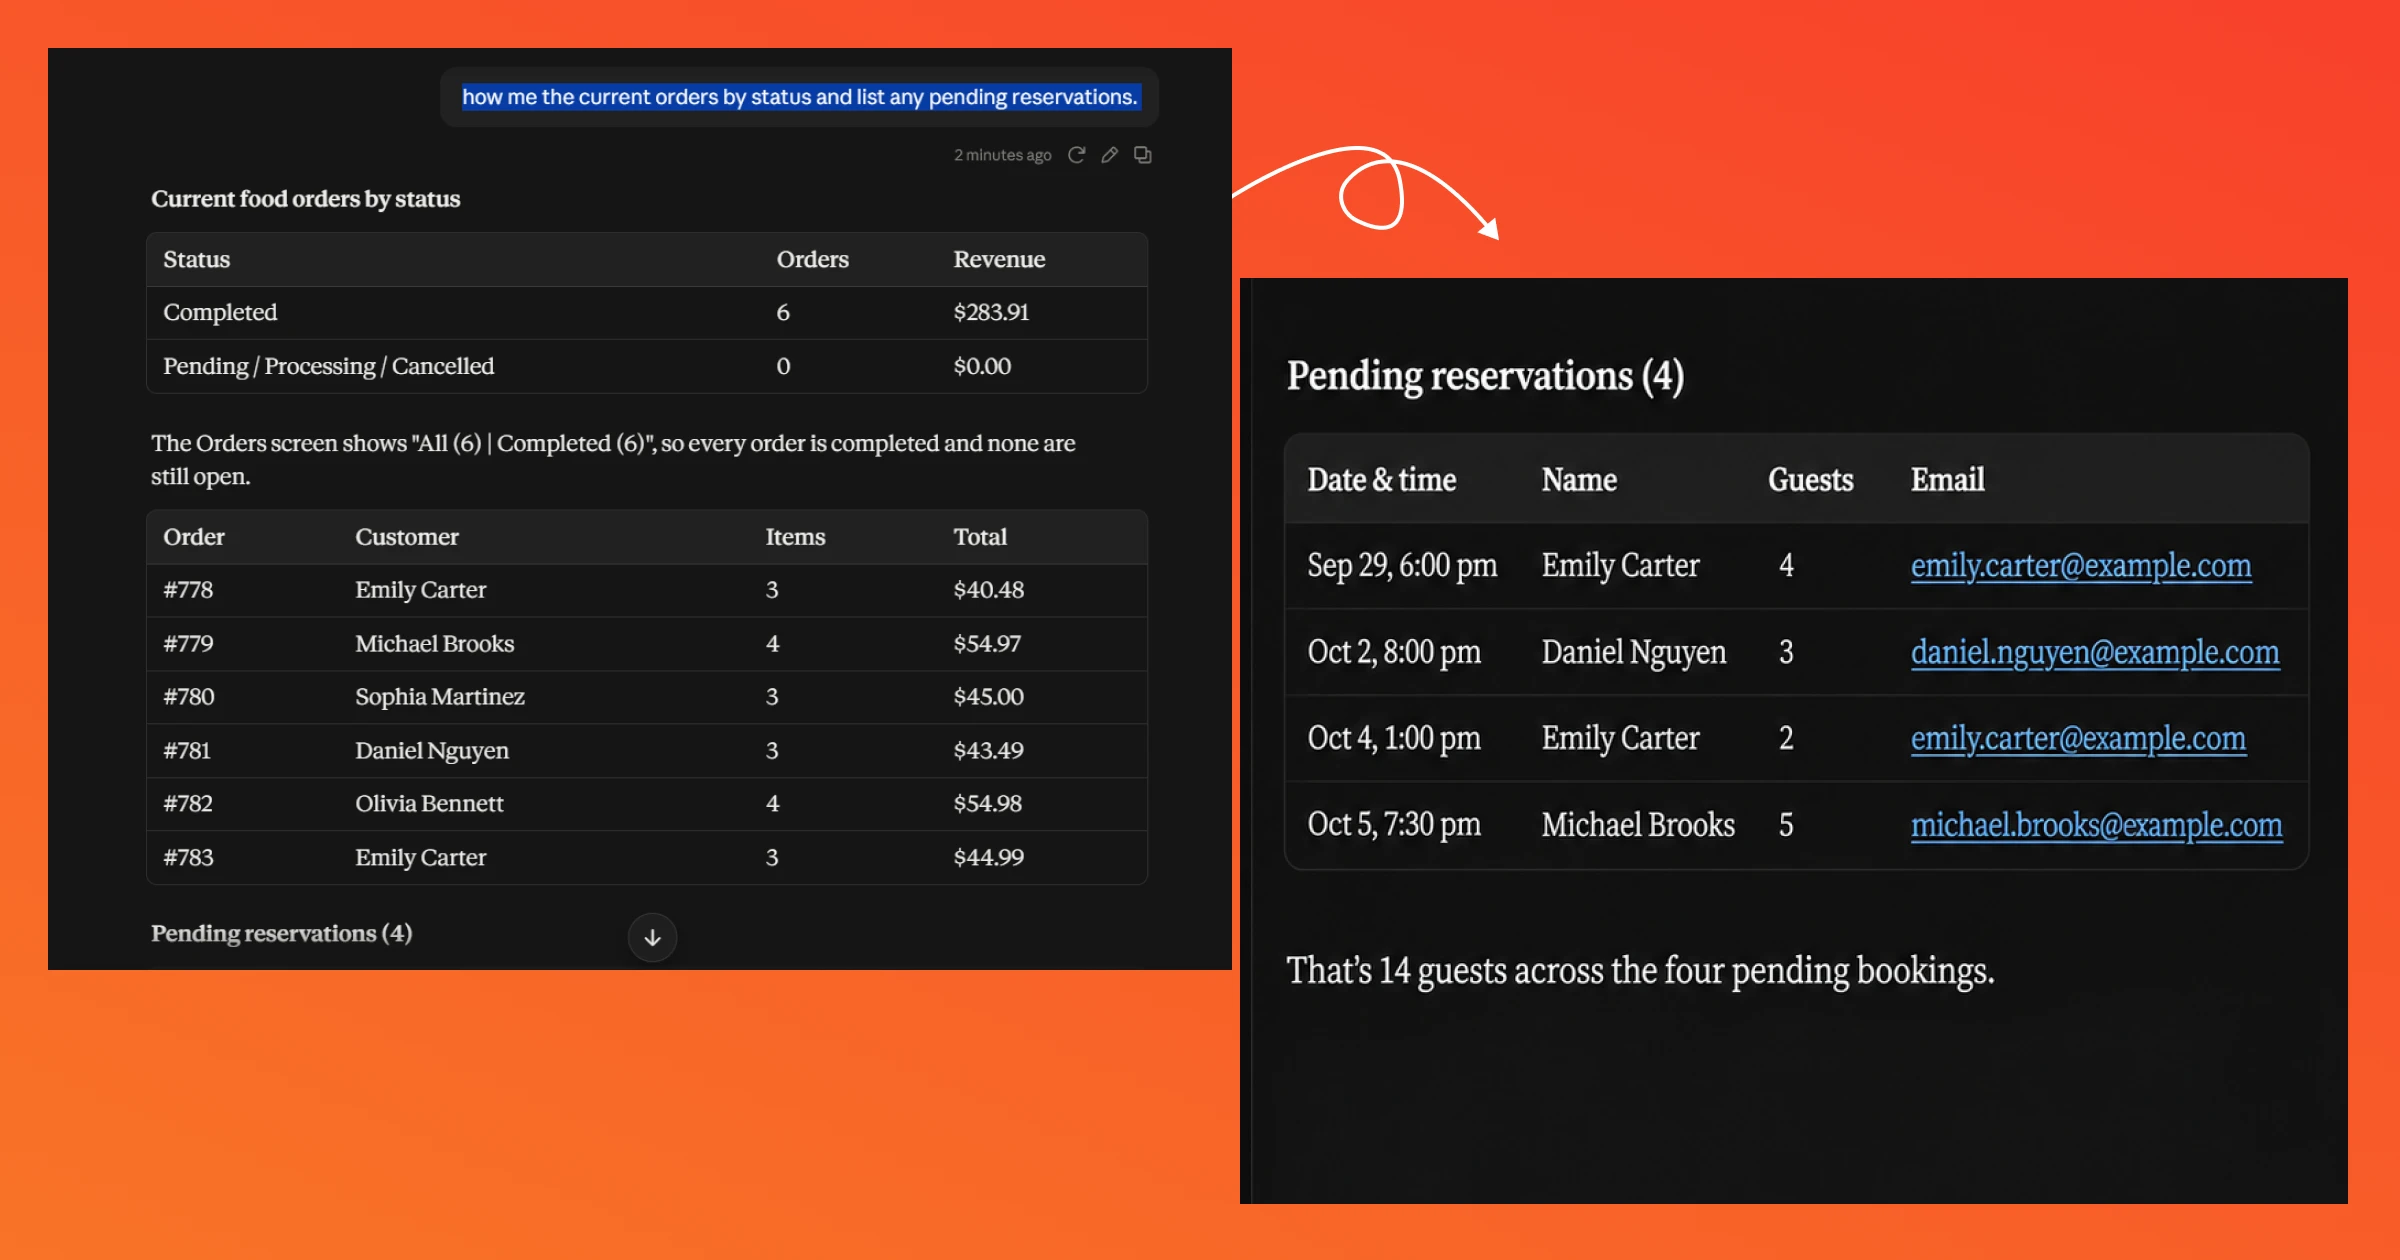
Four pending bookings for 14 guests are a clear to-do: confirm them before the weekend, or free up those tables for walk-ins.
Step 5: Record results in a weekly scorecard
Write the numbers down each week so you can compare them. Copy this scorecard into a spreadsheet or notebook:
| Metric | This week | Last week | Change | Action | Owner |
|---|---|---|---|---|---|
| Total revenue | |||||
| Total orders | |||||
| Average order value | |||||
| Top-selling item (and share) | |||||
| Slowest item | |||||
| Pending reservations | |||||
| Cancelled orders |
Prompts to fill it in:
- Revenue, orders, AOV: “Give me a sales overview for the last 7 days.“
- Top and slowest items: “What were our best-selling menu items this week?“
- Pending reservations and cancelled orders: “Show me orders by status and list pending reservations.”
- Week-over-week change: “Compare this week’s revenue and orders with last week.“
- Quiet days: “ Which day this week had the fewest orders?” (needs a few weeks of orders to spot a pattern)
The Action and Owner columns matter most. Every review should end with two or three actions and a name next to each one. The next section shows how to choose them. You can also explore Data Analytics for Restaurants to know how to use restaurant sales data to take actions.
How to Turn Sales Insights Into Actions
A sales report is only useful if it changes what you do next week. Run each finding through three steps: Insight → Decision → Action. The data gives you the insight. You make the decision because you know your guests and your neighborhood. Next week’s review shows whether the action worked.
Example 1: A dish keeps climbing
If the same item tops your sales two weeks in a row, it’s a pattern, not a lucky week. Feature it as your menu of the day, move it higher on your QR menu, and prep more before busy services.
In our test, the Classic Smash Burger led with 9 units and $116.91 in sales, so that’s the one we’d watch.
Example 2: One day is consistently quiet
When the same weekday stays slow for a few weeks, test an offer on that day instead of discounting the whole week. Ask your assistant to create a discount code (a WPCafe Pro feature), promote it on that day only, and compare the next week’s orders with your usual numbers.
Example 3: Bookings need follow-up
Pending reservations are revenue at risk. In our test, one question returned 4 pending bookings for 14 guests, a ready-made to-do list. Confirm them before the weekend and check again in your next review.
For more on keeping tables and orders under control, see our guides to building a restaurant table management system and managing high-volume restaurant orders.
Scaling Weekly Sales Reviews Across Multiple Restaurant Websites
If you manage several WordPress restaurant sites, the routine pays off even more. You don’t need a new reporting process for each site. Set up a separate WPCafe MCP connection for every site, each with its own name and Application Password, and ask the same questions each time.
For agencies, this gives you one consistent reporting framework for every client:
- Connect the client’s WPCafe site.
- Run the same core sales questions.
- Record the results in the client’s weekly or monthly scorecard.
- Flag the changes that need attention.
- Check those actions in the next reporting cycle.
The result is restaurant performance analytics your clients can compare month to month, without you logging into every dashboard.
WPCafe supports multiple restaurant locations on one site, and WPCafe MCP can list and manage those locations. Whether a specific sales question can be filtered by branch depends on your setup. Test it on your own site before promising branch-level reports to a client.
What AI Sales Reports Cannot Tell You
AI shows you what changed in your sales. It can’t tell you why. WPCafe records what guests ordered, booked, and paid, but not:
- Food and labor costs: a best-selling dish can still be one of your least profitable.
- Supplier prices: rising costs never show up in order data.
- Weather, local events and competitors: a rainy week or a new restaurant nearby can move sales either way.
- Orders outside WPCafe: phone bookings, walk-ins or delivery-app orders that aren’t entered won’t appear in any answer.
Treat the report as a starting point for questions. If revenue rises, find out what drove it. If a dish drops, look into it before removing it. If a promotion brings more orders, check that the extra demand was worth the discount.
Is WPCafe MCP Right for Your Restaurant?
WPCafe MCP helps most when you already have the data but pulling it together each week takes too long.
Good fit if
- You already use WPCafe and an MCP-compatible client such as Claude Desktop, Cursor, or VS Code.
- You’d rather ask questions than check several screens.
- You manage several restaurant sites and want one repeatable routine.
Not ideal if
- You need inventory forecasting or full accounting reports.
- You rarely analyze sales, or the WPCafe dashboard already covers what you need. Aisentic, our AI copilot for the WordPress dashboard that works with WPCafe, is another option.
Free vs Pro
WPCafe MCP’s core tools work with free WPCafe, including orders, reservations, menu, locations, QR codes, and analytics. Discounts, seat plans, receipts, and time-based products need WPCafe Pro, so you only need Pro once your routine includes promotions.
Frequently Asked Questions
How often should a restaurant review its sales: daily, weekly or monthly?
Weekly works best for most restaurants. Daily checks catch service problems, like a dish running out. Weekly reviews show demand patterns you can act on the next week without reacting to every slow day. Monthly reviews suit cost, profit and staffing decisions, which you’ll track separately in your accounting tools.
How do I compare this week’s restaurant sales with last week?
Record the same core numbers every week: revenue, orders, average order value, top sellers, and pending bookings. Then calculate the change for each: (this week − last week) ÷ last week × 100. With WPCafe MCP, you can also ask your AI assistant to compare two periods in plain language.
Can I build a restaurant sales report without a POS?
Yes, if your orders and reservations run through WPCafe on WordPress. Your revenue, orders, best-selling items, and bookings are already recorded there, so the WPCafe dashboard or WPCafe MCP can report on them. Cost data like labor and food cost still lives in your payroll or accounting tools.
Can AI predict my restaurant’s future sales?
Not reliably on its own. AI can spot patterns in your past sales, such as busy days or dishes that keep selling well. But any prediction depends on how much data you have, how accurate it is, and outside factors like weather and local events. Use AI insights to support your planning, not as guaranteed forecasts.
Turn Your Restaurant Sales Data Into Your Next Decision
A restaurant sales report doesn’t have to be another admin chore. Pick one review day, ask the same questions, and turn two or three insights into actions. The next week, check what changed.
That’s how you increase restaurant sales with AI without handing your decisions to it. AI gets you to clear answers faster, and you decide what happens next. For more ways to grow orders and bookings, read how WPCafe helps boost restaurant sales.
Start turning your restaurant sales data into actionable insights with WPCafe MCP.
Get Clear Restaurant Sales Insights With WPCafe MCP
Use WPCafe MCP to turn restaurant sales data into weekly sales reports, menu sales analysis, and actionable insights.

