How to Use Event Data to Improve Future Events (Step-by-Step Guide)

Did your last event go as planned, or did you feel something was missing?
Every event generates data, from ticket sales and registrations to attendee behavior and feedback. This data shows what worked, what failed, and where you can improve next time.
In this guide, you’ll learn how to use event data to improve future events. We’ll walk through the key data points to track, how to analyze them, and how to turn insights into better planning, higher engagement, and stronger results for your next event.
Ready to run smoother events?
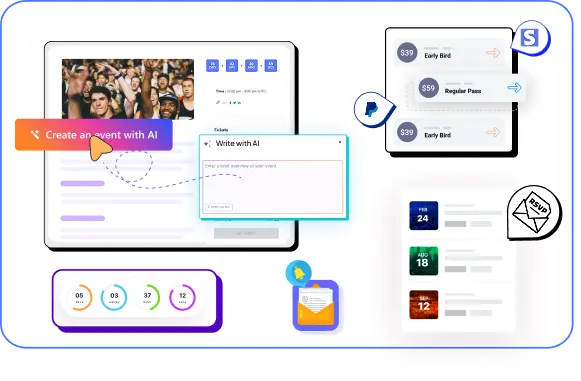
Create & manage events easily with Eventin event manager.
- ✅ Sell tickets
- ✅ Track attendees
- ✅ Automate reminders

5 effective ways to use event data to improve future events
Before you can improve future events, you need to know how to use the data from your past ones. Event data helps you understand attendee behavior, content performance, and marketing results.
Instead of guessing what went wrong or right, you can rely on real numbers and feedback. The following five methods show how to turn event data into clear actions that help you plan better and deliver stronger events next time.
1. Analyze attendance and registration patterns
Attendance and registration data are the starting point of event data analysis. Before looking at engagement or feedback, you need to understand how people responded to your event at the top level. This data shows whether your event attracted the right audience and how well your planning worked.
Start by comparing total registrations vs actual attendance.
For example, if 1,000 people registered but only 650 attended, you have a 35% drop-off. That gap is not random. It usually points to issues such as unclear expectations, poor reminder timing, or an inconvenient event schedule.
Use this simple check to spot early problems:
- High registrations but low attendance → timing, reminders, or perceived value need work
- Low registrations → promotion, targeting, or pricing may be off
You should also break down registrations by source. For example:
- Email campaigns
- Social media posts
- Paid ads
- Partner referrals
This data reveals which channels bring serious attendees and which ones only drive sign-ups without real attendance. These numbers become important event metrics and KPIs for future planning.
How to measure event data:
Attendance rate = (Total attendees ÷ Total registrations) × 100
Example:
- Registrations: 500
- Attendees: 400
Attendance rate = (400 ÷ 500) × 100 = 80%
Finally, document these findings in your event reporting and insights. Over time, this makes it easier to analyze event data, spot patterns, and improve future events using real performance data instead of guesses.
📚 Related reading: How to Build an Event Marketing Funnel That Actually Works 👉 Read more
2. Use ticket sales data to improve pricing and offers
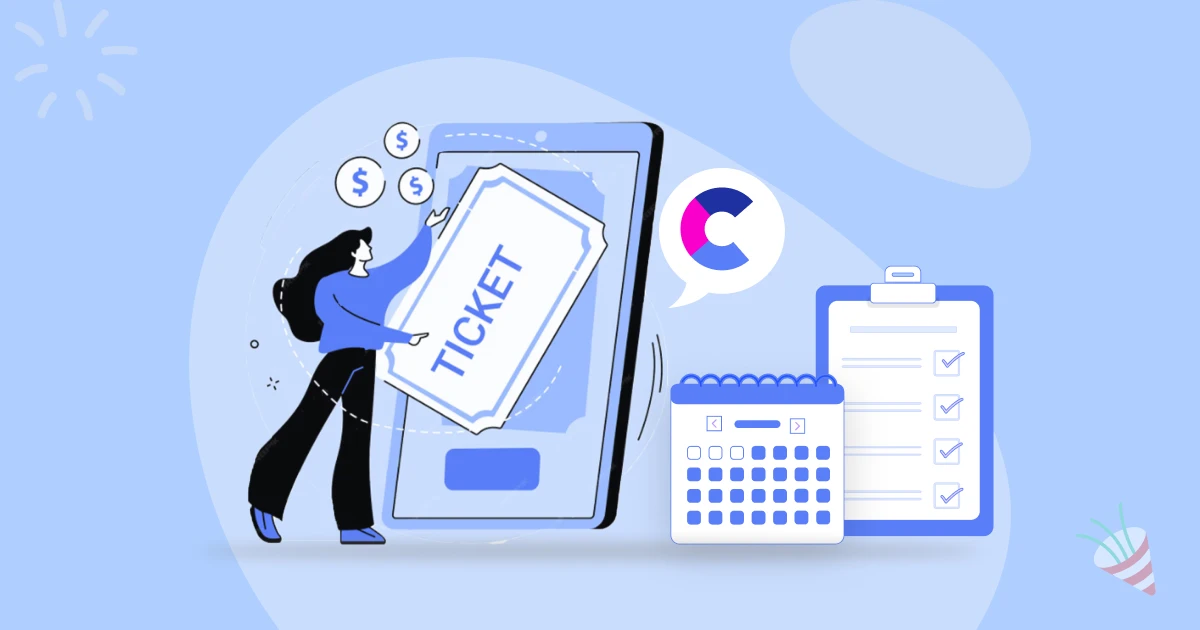
Ticket sales data plays a big role in event data analysis, especially when you want to understand what motivates people to buy. It shows how pricing, offers, and urgency affect registrations and revenue.
Start by reviewing how each ticket type performed. Look at early bird, regular, and last-minute tickets separately. For example, if early bird tickets sold out fast but regular tickets slowed down, it may mean your audience responds better to urgency and discounts.
Key things to review in your event performance data:
- Which ticket types sold the most
- When ticket sales peaked
- Which prices converted better
Next, analyze how pricing affected behavior. This information helps define clear event metrics and KPIs, such as conversion rate by ticket type and revenue per attendee.
How to measure event ticket conversion rate:
Conversion rate = (Tickets sold ÷ Page visitors) × 100
Example:
- Event page visits: 2,000
- Tickets sold: 200
Conversion rate = (200 ÷ 2,000) × 100 = 10%
When you analyze event data this way, you can set smarter prices, create better offers, and increase attendance without guessing.
📚 Related reading: 10 Proven Venue Marketing Strategies That Drive More Bookings (and Keep Your Calendar Full) 👉 Read more
3. Identify high-engagement content and sessions

High engagement shows what your audience truly cares about. When you analyze which sessions people attended, stayed for, and interacted with, you get clear direction for improving future events.
This step is a key part of event data analysis because it focuses on attendee behavior, not assumptions.
Start by reviewing session-level event performance data. Look at which sessions had the highest attendance and which ones lost people early.
For example, if a session started with 300 attendees but dropped to 180 within 10 minutes, the topic or delivery may not have matched expectations.
How to measure event engagement rate:
- Total attendees: 300
- Attendees who joined Q&A or polls: 180
Engagement rate = (180 ÷ 300) × 100 = 60%
Key engagement metrics to review:
- Session attendance numbers
- Average watch or stay time
- Drop-off points during sessions
- Q&A and chat activity per session
Next, compare sessions by topic, speaker, or format. You may notice patterns such as workshops performing better than lectures, or panel discussions keeping people engaged longer. These insights are valuable for event analytics for marketers when planning future agendas.
You should also look at interaction data. Sessions with more questions, poll responses, or comments usually indicate strong interest. For example:
- Session A: 20 questions, high poll participation
- Session B: 2 questions, low interaction
This difference helps define important event metrics and KPIs related to content quality and audience interest.
Finally, summarize these findings in your event reporting and insights. Add top-performing sessions and content formats to your post-event analysis checklist.
When you consistently analyze event data this way, you can design future events around proven topics, speakers, and formats that keep attendees engaged from start to finish.
📚 Related reading: How to Build an Event Community That Keeps Growing 👉 Read more
4. Improve event experience using attendee feedback

Attendee feedback helps you understand what numbers alone cannot explain. While event performance data shows what happened, feedback tells you why it happened. This makes feedback a critical part of event data analysis.
Start by collecting feedback right after the event, when experiences are still fresh. Use short surveys with clear questions. Ask about session quality, speakers, event flow, and overall satisfaction. Open-ended questions often provide the most useful event reporting and insights.
Focus on patterns, not individual opinions.
For example:
- If many attendees mention audio issues, it’s a real problem
- If multiple people praise a session format, it’s something to repeat
Common feedback areas to analyze:
- Content relevance and clarity
- Speaker quality and pacing
- Event length and scheduling
- Technical or access issues
Next, turn feedback into measurable insights. Combine survey responses with event metrics and KPIs, such as engagement and attendance. For instance, a low-rated session with high drop-off confirms that content needs improvement.
This approach strengthens event analytics for marketers.
Finally, document feedback insights in your post event analysis checklist. List what to fix, what to improve, and what to keep.
When you regularly analyze event data alongside attendee feedback, you create better experiences, increase satisfaction, and build events people want to attend again.
📚 Related reading: Eventin User Journey: A Local Cinema Theater’s Real Struggle-to-Success Story 👉 Read more
5. Optimize marketing efforts with performance data
Marketing performance data shows how people discover your event and what convinces them to register. This step in event data analysis helps you stop guessing and focus on what actually brings results.
Start by reviewing event performance data by channel. Look at email campaigns, social media, paid ads, partners, and referrals. Track the full journey, not just registrations.
Key marketing metrics to review:
- Event page visits by channel
- Registration conversion rate
- Cost per registration
- Attendance rate by source
For example, paid ads may drive high traffic but low attendance, while email may bring fewer registrations but higher-quality attendees. These insights are critical for event analytics for marketers.
Next, review campaign-level performance. Compare different emails, ads, or posts.
- Email open rate and click-through rate
- Ad click-through rate and cost per click
- Social engagement vs actual registrations
This helps identify which messages and timing drive real results and improve key event metrics and KPIs.
You should also analyze audience data. Compare results by device, location, or audience segment. If mobile users register more but attend less, it may signal access or reminder issues. These findings strengthen your event reporting and insights.
How to measure event ROI (return on investment)
Event ROI shows whether your event was worth the time and money you invested. It is one of the most important checks in any post event analysis checklist.
Event ROI formula:
ROI = (Event revenue − Event cost) ÷ Event cost × 100
Example:
- Event revenue: $15,000
- Total event cost: $10,000
ROI = (15,000 − 10,000) ÷ 10,000 × 100 = 50% ROI
Finally, document all marketing and ROI insights in your event reporting and insights. Add them to your post event analysis checklist so each event improves the next one.
This turns event data analysis into a repeatable growth strategy, not a one-time review.
Conclusion
Event success should never depend on guesswork. When you use event data analysis, you understand what worked, what didn’t, and how to improve your future events with confidence.
Over time, these insights help you plan smarter, reduce mistakes, and deliver better experiences for your audience. Additionally, if you want an easier way to track, analyze, and act on event data, Eventin can help.
Eventin event manager helps you manage events, sell tickets, track registrations, and access detailed reports from one dashboard. You get the data you need without juggling multiple tools.
Frequently asked questions (FAQs)
What is event data analysis?
Event data analysis is the process of reviewing data from your events, such as registrations, attendance, engagement, and feedback, to understand what worked and what didn’t.
What event data should you track after an event?
You should track registrations, actual attendance, ticket sales, engagement levels, feedback scores, and marketing performance. These are core event metrics and KPIs used in post-event analysis.
How can event data help improve future events?
Event data shows what your audience likes, where they lose interest, and which marketing efforts work best. Using these insights helps you plan better future events.
How do you measure event ROI?
Event ROI is measured by comparing event revenue with total costs. The formula is: (Event revenue − Event cost) ÷ Event cost × 100.
How does Eventin help with event data analysis?
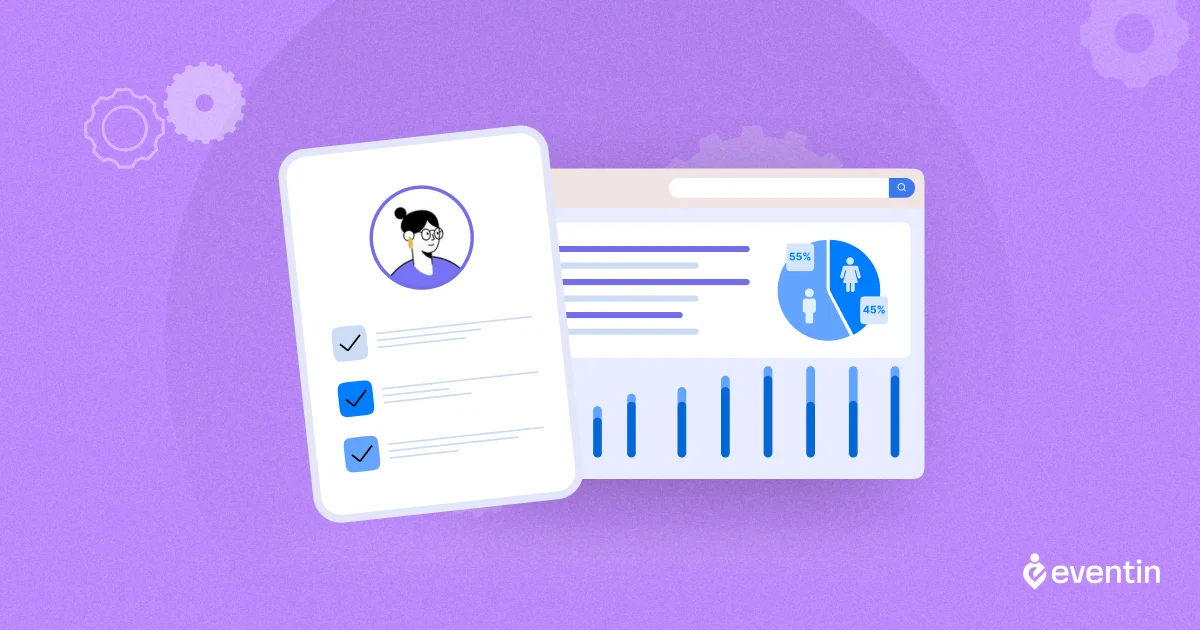
Eventin gives you a clear and easy-to-understand reporting dashboard where all your event data is organized in one place. You can track attendee details, ticket sales, and booking data at a glance. The attendee and booking reports are well-structured, easy to read, and can be exported when needed.
Is Eventin suitable for small and large events?
Yes. Eventin works well for small meetups, online events, and large conferences. You can start with the free version and scale as your event needs grow. Additionally, Eventin supports seat plan setup, making it easy to manage everything from small indoor venues to large halls or stadium-style events.