How Data Analytics Helps Restaurants Optimize Menus & Boost Sales
Table of Contents
Ever wondered why some restaurants grow fast while others struggle, even with great food? The secret isn’t always the recipes — it’s the data behind every order.
Modern restaurants rely on data analytics to learn what customers love, when sales peak, and which dishes bring in the most profit. When there is no proper data, many owners keep guessing — and lose money without realizing it.
Keep reading…
Today, I will show you how data analytics helps restaurants understand their customers better, optimize menus, and make smarter decisions that boost sales.
Why do modern restaurants depend on data for better outcomes?
Running a restaurant today means dealing with fast-changing trends, tough competition, and rising costs. Depending only on experience or instinct isn’t enough anymore.
Now, it’s really important to have the right information.
Data helps restaurant owners see what’s really happening in their business — not just what they think is happening. With sales reports, customer feedback, and order history, you can understand what sells best, which hours are busiest, and where money is being wasted.
🍕 Domino’s Pizza transformed its business with real-time data tracking. The company uses analytics to monitor every order from placement to delivery, cutting delivery time by 35% and increasing online orders to more than 70% of total sales. (Source: Harvard Business Review)
When restaurants use this data, they make smarter choices: updating menus based on demand, setting the right prices, managing ingredients better, and improving customer satisfaction.
Simply put, data gives you facts to act on — not guesses. And that leads to better results, steady growth, and more profit.
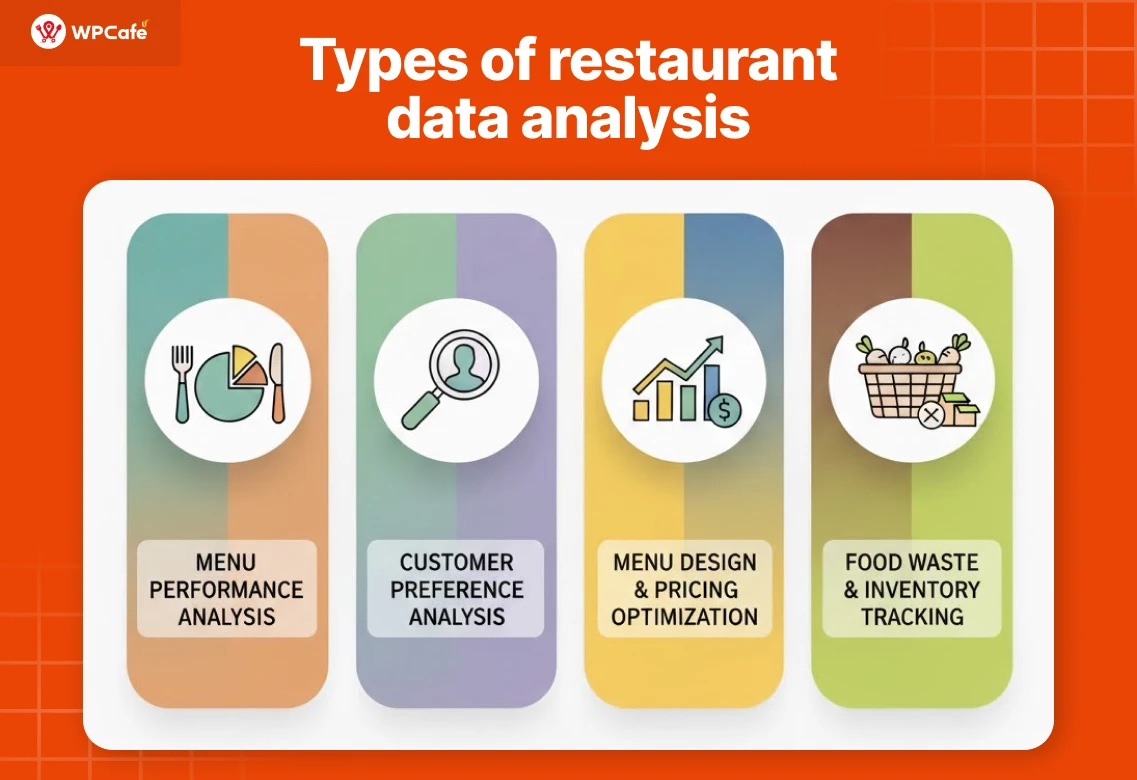
Types of restaurant data analysis: What giant food franchises are applying
Big restaurant chains didn’t grow by luck — they grew because they treat data like their second chef. Every decision, from menu layout to ingredient ordering, is driven by analytics.
Here’s how leading restaurants use different types of data analysis to stay ahead.
1. Sorting high-performing and low-margin dishes
Top brands like McDonald’s and Chipotle constantly analyze which items drive the most profit.
–McDonald’s uses point-of-sale (POS) and regional sales data to track performance across locations. When an item underperforms or costs too much to produce, it’s either reformulated or replaced.
–Chipotle runs a similar menu analysis — pairing sales reports with ingredient cost data to ensure every burrito and bowl earns a healthy margin. This approach helped them reduce low-profit items and grow menu profitability year over year.
2. Finding out what your guests really want
Starbucks does this better than almost anyone. Using its “Deep Brew” AI system, it studies millions of transactions to learn customer habits — favorite drinks, seasonal patterns, and time-of-day orders.
That’s why you’ll see personalized drink suggestions in the Starbucks app — all based on your own purchase data.
Similarly, Domino’s uses data to understand customer preferences by location and order history. This helps them design better deals and recommend the right menu items to boost repeat sales.
3. Innovative menu design and pricing strategies
Data-driven menu design is why chains like KFC and Burger King know exactly which combos to highlight.
They analyze eye-tracking heatmaps, online ordering behavior, and A/B-tested layouts to design menus that guide attention to high-margin items.
For pricing, Panera Bread and Chipotle use real-time ingredient cost and demand forecasting. This allows them to adjust prices slightly by region or time of year while keeping customer trust intact — smart pricing without surprises.
4. Measuring food waste and managing inventory with real-time tracking
Food waste costs restaurants billions each year — and big brands don’t ignore that.
Subway uses predictive inventory tracking to know exactly how much of each ingredient to prep daily, cutting waste significantly.
Olive Garden combines sales data with kitchen reports to see where waste happens most — like over-prepped pasta or unused sauces — and adjusts batch sizes accordingly.
Real-time dashboards now help managers track ingredient usage, stock levels, and spoilage across hundreds of outlets — something that wasn’t possible just a few years ago.
How to analyze customer data for better outcomes or to drive revenue?
Customer data isn’t just a list of numbers — it’s the story of how people interact with your restaurant. It tells you what dishes they love, when they visit, what they skip, and why they come back (or don’t).
Here’s how successful restaurants — from small cafés to brands like McDonald’s and KFC Bread — use data analytics step by step.
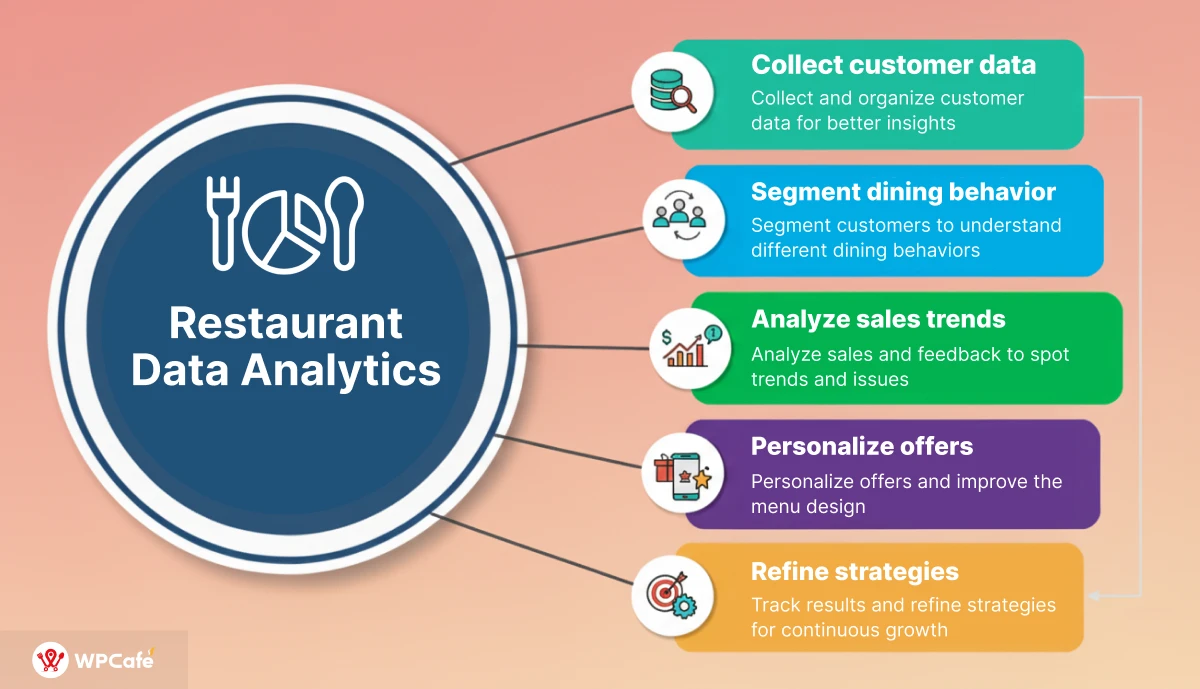
Step 1: Collect and organize customer data for better insights
Everything starts with data collection. The first step is making sure you’re capturing the correct information. Data can come from multiple touchpoints in your restaurant. Your task is to pull it all together in one place and make sense of it.
What to collect
a. Sales data:
- What dishes are selling the most (and when).
- Average ticket size, discounts used, and time of purchase.
- Order type — dine-in, delivery, or takeaway.
b. Customer data:
- Names, emails, phone numbers (from loyalty apps or reservation systems).
- Visit frequency, average spend, and preferred time of visit.
c. Operational data: Ingredient usage, stock levels, delivery times, and staff hours.
d. Feedback data: Ratings, social media mentions, comment cards, and online reviews.
Once collected, organize it using a POS dashboard, Excel sheet, or software like Toast, Square, or Lightspeed.
A small pizza shop called “MaddPizza” in Singapore saw that most of its orders from 12 to 3 PM came from offices nearby, within 2 kilometers. They made a new “Lunch Rush Combo” and offered free delivery before 3 PM.
💥 Pro tips
- Collect data weekly, not just at the end of the month.
- Label sources properly (POS, review, social, app).
- Keep only what’s useful — clutter kills insight.
- Use color codes or filters to spot patterns faster.
Step 2: Segment customers to understand different dining behaviors
Not all customers are the same. Some visit weekly, some only for special occasions, and some order takeout more than dine-in. By segmenting customers, you can understand unique patterns and serve them better.
| Segment | Behavior | Best way to engage |
| Regulars | Visit weekly, order same items | Loyalty rewards, thank-you emails |
| Occasional diners | Visit 1–2 times per month | Time-limited offers, new menu alerts |
| First-time visitors | Trying your food once | Welcome offer, survey for feedback |
| High spenders | Order combos or premium dishes | Exclusive deals, early access |
| Budget eaters | Focus on value meals | Bundle offers or weekday discounts |
Starbucks groups customers based on time of visit and drink type.
Morning coffee buyers get breakfast combo offers, while evening customers see dessert or snack promos. This simple segmentation drives repeat orders and higher engagement in their app.
How to do it yourself
- Export the last 90 days of orders.
- Add a “visit count” column per customer.
- Group them into 3–4 types using filters.
- Tailor one offer for each group.
💥Pro tips: Use “Recency, Frequency, and Monetary” (RFM) scoring to rank customers by loyalty and value.
Step 3: Analyze sales and feedback to spot trends and issues
Data only matters if you actually use it. Look at your sales reports and feedback regularly to see what they’re telling you. Once you know who your customers are, the next step is to find what’s working and what’s broken.
Sales analysis checklist
- Identify your top 10 dishes by total sales.
- Find their cost-to-profit ratio (food cost ÷ selling price).
- Highlight low-margin items that still sell well — they may need a small price bump.
- Check daily and weekly patterns to plan staff shifts and promotions.
Feedback analysis checklist
- Collect all Google, Facebook, and delivery app reviews.
- Group comments by themes — taste, portion, wait time, packaging, service.
- See what repeats often — that’s your real issue.
Piedra Restaurant in Singapore (one of our restaurant software users) discovered that nearly 30% of customer complaints were about food arriving cold.
After carefully analyzing complaints and order data, they switched to a better packaging supplier and added a simple reheating note for certain meals.
💥 Pro tips
- Always link customer feedback with the order data. You’ll find patterns (e.g., “same item, same problem”).
- If one dish gets bad reviews but sells a lot — fix it fast. It’s hurting your brand quietly.
Step 4: Personalize offers and improve the menu design
Now that you understand your customers and overall performance, it’s time to turn those insights into action. This is where real profit growth begins.
Personalize Offers
Customer data lets you create offers that feel tailor-made:
- Regulars: Reward loyalty with perks like “Free drink on your 5th visit.”
- Lapsed customers: Re-engage them with messages such as “We miss you! Drop by this week for a dessert on us.”
- High spenders: Give VIP treatment—early access to new dishes or tasting events.
- Lunch crowd: Use time-based deals like “Order before 2 PM and get 10% off.”
💥 Pro Tip: Avoid running permanent discounts. Instead, use limited-time promos to keep offers exciting and protect your margins.
Optimize the Menu
A data-driven menu is not just about design—it’s about driving sales and profitability.
- Highlight top-selling, high-margin items in prime spots (like the first 3 positions or with standout icons).
- Suggest pairings based on order patterns—e.g., “Customers who ordered pizza also added garlic bread.”
- Remove confusing or underperforming dishes.
- Experiment with pricing—small changes (5–7%) often go unnoticed but increase profit.
💥 Pro Tip: Refresh your menu quarterly using the latest customer data. Combine “popular” and “profitable” items in the same spotlight zone to maximize impact.
Step 5: Track results and refine strategies for continuous growth
Analyzing data isn’t a one-time task—it’s an ongoing cycle. After every change, measure the impact, learn, and improve.
What to track monthly:
| Metric | Why It Matters |
| Repeat customer rate | Measures loyalty and satisfaction |
| Average order value (AOV) | Shows if upselling or combos work |
| Food cost percentage | Tracks how well you manage expenses |
| Menu item performance | Identifies winners and laggards |
| Customer sentiment score | Detects satisfaction changes |
“Panera Bread”, a popular US food company, constantly monitors loyalty app data to see how new items perform after launch.
If a new menu item doesn’t perform within 4 weeks, they tweak the recipe, rename it, or replace it — keeping only the top performers.
Continuous improvement cycle
- Test one idea: like a new lunch combo.
- Measure its effect: look at sales + feedback after 2 weeks.
- Adjust: tweak pricing, portion, or offer based on results.
- Repeat: small, consistent changes win over time.
💥 Pro tips: Share insights with your team. Chefs, cashiers, and waiters often have the best context behind the numbers.
📊 Want to analyze your restaurant data for free?
Try WPCafe — 100% free restaurant management solution that gives you a complete set of tools to grow your restaurant online and offline:
- 📈 Restaurant dashboard for real-time insights
- 💰 Sales reports to track revenue and profit
- 🔥 Trending items filter to spot best-sellers
- 🍽️ 34+ food menu designs to fit any restaurant style
- 🧩 Widgets for quick menu display and promotions
- 🗓️ Reservation system to manage bookings easily
No setup cost, no coding — just insights that help you sell smarter.
Get WPCafe FreeFinal takeaway: Start using data to make smarter restaurant decisions
Data analysis isn’t just for big brands — any restaurant, cafe, or local food shop can use it to make better decisions every day.
Your sales reports, customer reviews, and order history already tell a story. When you start reading that story, you’ll see what your guests love, which dishes bring the most profit, and where you might be losing money.
Start using your data today. Make smart choices, serve what people love, and let numbers guide your restaurant’s success.